

Úlfar Erlingsson
Mukkai Krishnamoorthy
Rensselaer Polytechnic Institute
Troy, New York 12180-3590, USA
ulfar@cs.rpi.edu
moorthy@cs.rpi.edu
We discuss a system for performing interactive graph drawing on the World Wide Web (WWW), implemented in the Java programming language. The system allows for highly interactive experimentation in graph drawing, supporting direct user interaction and parameter adjustment during the embedding process. The use of Java and the WWW in its implementation makes the system globally available, both for interactive use and for integration into other systems, regardless of computer platform details. We present the design, implementation and use of the system, as well as some experimental results.
Since the field of graph drawing algorithm design originated with [18] and [13], it has grown tremendously, especially in the last decade as high-resolution graphical devices have become commonly available. A good survey of the field, containing most relevant references, can be found in [2]. However, graph drawing systems, such as the GraphEd system [11], have so far been limited to specific computer platforms and environments. This is an unfortunate obstacle to easy experimentation and usage of graph drawing implementations. Attempts to remedy this based on server-side solutions, e.g., Diagram Server [9] and GraphPack [14], are inherently restricted by network bandwidth and server size. The WWW-based implementation methods presented in this paper show great promise for improving this situation.
Two main characteristics distinguish the system presented in this paper from other graph drawing systems: the ability to vary the parameters of the embedding interactively to get an appropriate layout of the given graph, and the fact that the system is inherently distributable and portable, with almost no installation cost across different platforms. In the remainder of this section we will describe the algorithms and methods used in our system. In the next section we discuss the importance of the WWW as a platform for graph drawing. In Section 3 we present the implementation of our system, its design and use in experimental graph drawing. Finally, in Section 4, we present the results of some experiments in graph drawing using our system.
| Graphs | Styles | Aesthetics | Methods |
| Trees | Straight-line | Minimum area | DFS |
| Planar | Polyline | Balanced | Annealing |
| DAGs | Spline | Minimum bends | Grid |
| General | Rectangle-vertex | Minimum crossings | Linear Algebra |
| Specific | Circle-vertex | Symmetric | Linear Progr. |
| Bipartite | Constrained | Uniform density | Heuristic |
| Orthogonal | |||
| Minimum edge length | |||
| Non-overlapping vertices |
Algorithms for drawing directed graphs and DAGs can be found in [8], [7] and [15]. Most of these algorithms draw general directed graphs by initial cycle-breaking by edge reversion and a subsequent DAG algorithm. The DAG algorithms from Bell Labs, described in [8] and [7], use a more complicated multi-pass algorithm which combines depth-first search, linear programming and heuristics. An example of a hierarchical embedding can be seen in the left half of Figure 1.
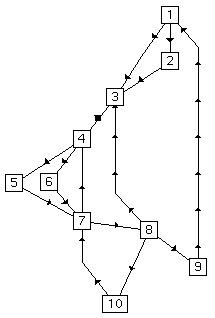
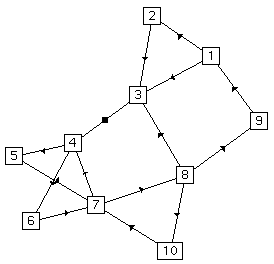
Drawing of general graphs is arguably best done using the force-directed methods of [16], [5] and [6], which are derivatives of Eades' early work in [3]. These methods use a simulated model of the graph in a pseudo-physical setting, replacing the edges with (magnetized) springs and the vertices with repulsive magnets. The graph is then laid out using an iterative simulated-annealing process, where the minimum-energy layout approximates the most aesthetically pleasing one. These methods are good for drawing balanced, uniformly distributed graphs with similar edge lengths, and the implementation of [16] can minimize edge crossings. The right half of Figure 1 contains an example of this embedding.
As far as the authors know, there were only two graph drawing systems available on the WWW at the time this paper was written. One was the experimental GraphPack [14], based on cgi-bin scripts, and the other one was the Java graph drawing demonstration program from Sun [19], which motivated this paper. The server-side solutions of GraphPack and Diagram Server [9] suffer from several disadvantages, namely high network overhead, possible server overload and a somewhat complicated network-specific installation. The Java program from Sun was written as a demonstration of the capabilities of the Java language and is therefore understandably severely limited in its features.
The system described in this paper is written in Java and the JavaScript scripting language, in such a way that all computation takes place at the client side, i.e., on the user's computer. This eliminates the need to make slow network connections in drawing each graph, and allows the graph drawing to be completely interactive and dynamic.
Our system supports many different kinds of embeddings, each implemented to support dynamic modifications and adjustments from the user, even while the embedding is still taking place. Thus the user can, at almost any time, adjust the position of vertices, modify the parameters controlling the embedding, and rotate the graph in three dimensions. This degree of interactivity is uncommon in graph drawing systems, and could not have been realized on the WWW using server-side techniques.
Another benefit of our system, stemming from its WWW-based implementation, is the possibility of integrating it effortlessly into another system, such as an information browser. Other packages can use our graph drawing system to graphically present the graph structure of information, with the possibility of embedded hyperlinks in the vertices. This usage does not require the encompassing package to install our system, and the end user need not even be aware that our system is not part of the package. Thus, our graph drawing system could be utilized in a succinct and transparent manner to browse objects in a different visualization system.
Our system suffers from the current disadvantages of client-side WWW-based programs, namely that the compiler/interpreter/network is in many cases too slow for practical use. Currently, our system may be sped up by downloading it on the local system, thereby removing the network connection requirement. In the future, these disadvantages will hopefully disappear, as better caching strategies, optimizing compilers and run-time compilation to native code are implemented for WWW-based programs.
The system is implemented using the object-oriented metaphor, with separate classes for vertices, edges and embeddings, as well as a central ``blackboard'' containing global information, such as the set of currently visible nodes. The blackboard contains a set of embeddings, each of which implements the interface (a feature of Java providing multiple-inheritance-like capabilities) common to all embedders, i.e., the functions Initialize and Embed. Addition of a new embedding requires only the implementation of a class satisfying the embedder interface and its registration into the blackboard.
Our system is currently started through a set of HTML pages written using JavaScript, which can be run through the Netscape WWW browser. It is easy for the user to input a new graph, for example, if the graph is not overly large, by entering it into an HTML form interface, or, if the graph is to be used more often than once, by creating a special HTML page containing the graph data. If the user employs the proper Java environment it is also possible to store and retrieve the graphs on the local file system, but this is by default disallowed for security reasons.
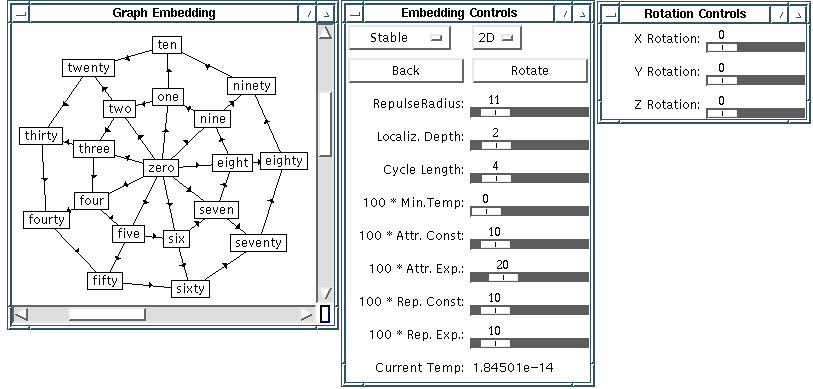
Once the system has been started, its interface consists of three windows: a main drawing panel displaying the graph, with scrollbars to allow panning; a general control window, containing controls allowing for the adjustment of various parameters, such as the embedding used; and a rotation control window. The windows of the interface can be seen in Figure 2. In the rest of this section we list the embeddings and the possible adjustments.
The user can at any time select among a number of different embeddings. Most of these reposition the vertices completely, but the force-directed methods iteratively lay out the vertices from their starting position. The methods are as follows:
All the above embeddings are implemented in both two and three dimensions, although only the force-directed algorithms produce very aesthetically pleasing graph layouts in three dimensions. In other respects, the embeddings are implemented for the most part as described in their respective sources.
An exception to this is the level-placement phase of the hierarchical embedding. In [15], the authors lament that their level-placement method does not minimize the total edge length of the resulting graph. Our implementation alleviates the problem of long edges by minimizing the total level sum of the vertices in the following manner: After the initial level placement by topological ordering, we scan the vertices again, now in reverse topological order, and lowering the vertices to their minimum possible level, i.e., one more than the highest level at which they are used. Since we do this in reverse topological order, all vertices are hoisted to their minimum possible level, thereby minimizing the total level sum and shortening edges crossing unnecessarily many levels.
The relaxed embedding has not been discussed in the literature, but is a simple modification of the force-directed methods. This embedding is of some interest, however, since it provides an excellent framework for user interaction with the graph. As the user moves vertices around during a relaxed embedding, the active forces provide tactile elastic feedback, which in a sense adds a new dimension to the graph layout, that of dynamic change and interrelation. This enhancement is in many ways analogous to the improved perception of pseudo-three-dimensional scenes when slight random movement is added.
The user of our graph drawing system can interact with the graph embedding process in a variety of ways. Some adjustments, such as explicit movement of vertices, can be made at any point, whereas others are specific to a particular embedding. The user may at any time do any of the following:
Below is a list of the embeddings, with a description of what embedding-specific adjustments the user may perform interactively during their execution.
The five solids can be seen in Figure 3, and are, respectively, the tetrahedron, the cube, the octahedron, the icosahedron and the dodecahedron. These are very regular graphs and easily drawn using force-directed placement, as they are in the figure.
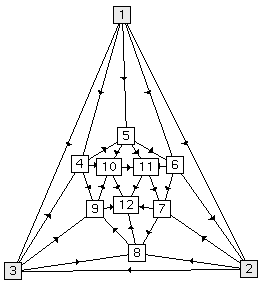
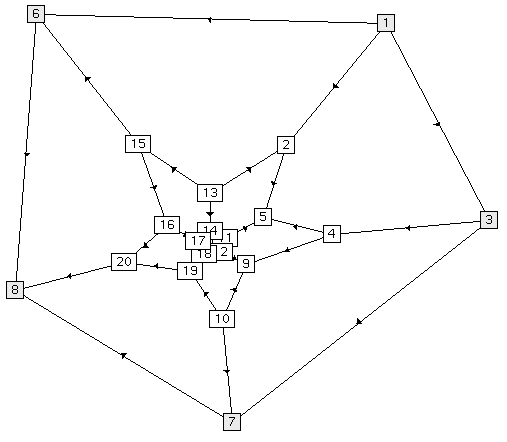
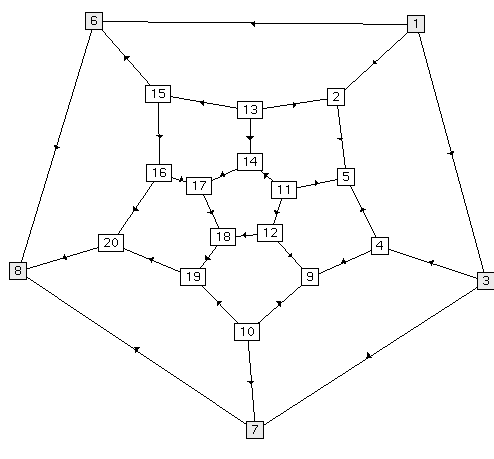
In Figure 4 we have also included a barycentric embedding of the icosahedron and dodecahedron, using cycles of length 3 and 5 respectively. In the case of the two leftmost embeddings, the outer cycle is fixed and the barycentric embedding has solved for the position of the remaining vertices. In the rightmost graph, however, we have used force-directed placement from the initial embedding in the center of Figure 4. This combination of methods gives excellent results, and is a good example of the power of interactive graph drawing. As we have emphasized earlier, the user can interact with the barycentric embedding in several different ways, e.g., by changing the length of the outer cycle and rotating the graph in three dimensions, the latter of which is in this case surprisingly helpful for visualization.
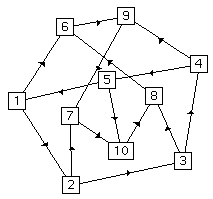
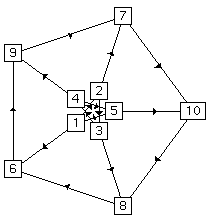
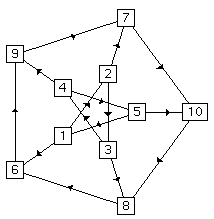
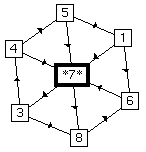
Figure 5 shows our embeddings of the Petersen graph. Reading from left to right the embeddings are force-directed, barycentric, barycentric followed by force-directed, and, finally, grouped force-directed. The Petersen graph is in general difficult to embed. It does not embed nicely with force-directed placement, as can be seen in Figure 5, whereas the barycentric method gives excellent results, especially when followed by force-directed placement. In the last figure, we have grouped all vertices within unit distance from vertex 7, surprisingly resulting in a hexagon.
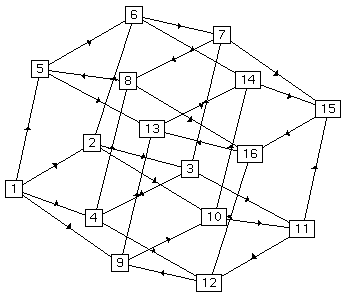
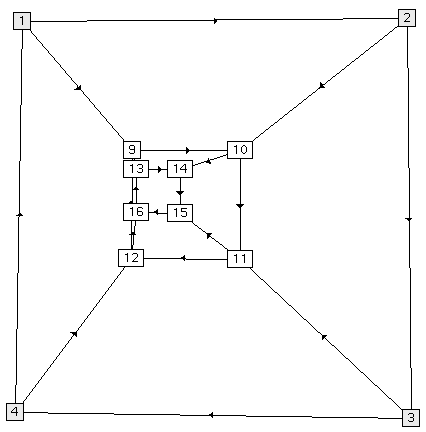
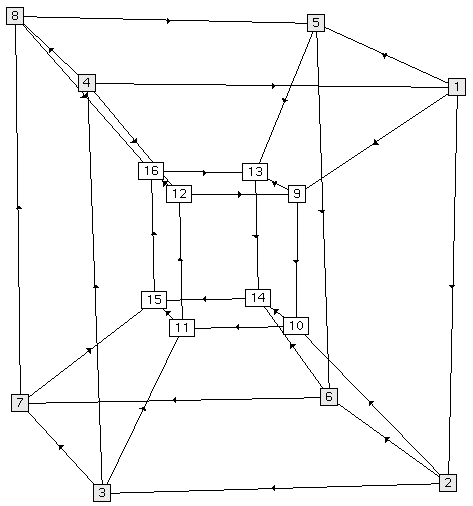
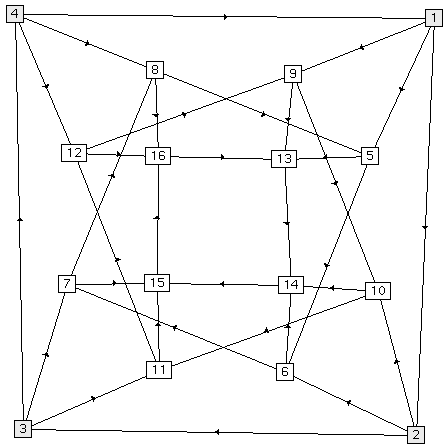
Finally, we have also embedded a four-dimensional hypercube. Figure 6 shows our results. The leftmost embedding is the result of a force-directed placement and, while aesthetically pleasing, does not clarify the interrelations of the graph. The second embedding from the left is a barycentric embedding, done with four fixed outer vertices. In this embedding, there are four vertices which are obscured by other vertices. If we fix these obscured vertices in a larger outer rectangle and perform a second barycentric embedding, we get the third embedding from the left. This is the embedding most commonly used to depict the 4-D hypercube. In the rightmost and final embedding, we have combined the barycentric and force-directed methods as before, with good results.
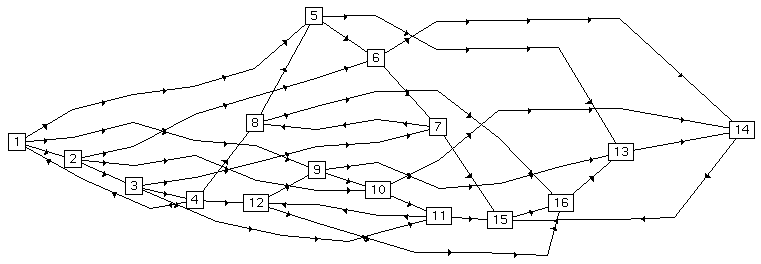
In Figure 7 we can see the outcome of running the hierarchical embedding algorithm on the hypercube. This embedding is of some interest, since, despite its complex nature, it has almost the minimum possible number of edge crossings.
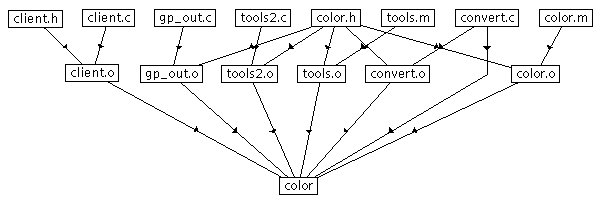
In software systems, ``makefiles'' are often used to specify the acyclic dependencies between files and to control compilation. In Figure 8 we can see a hierarchical embedding of the directed acyclic graph from such a makefile.
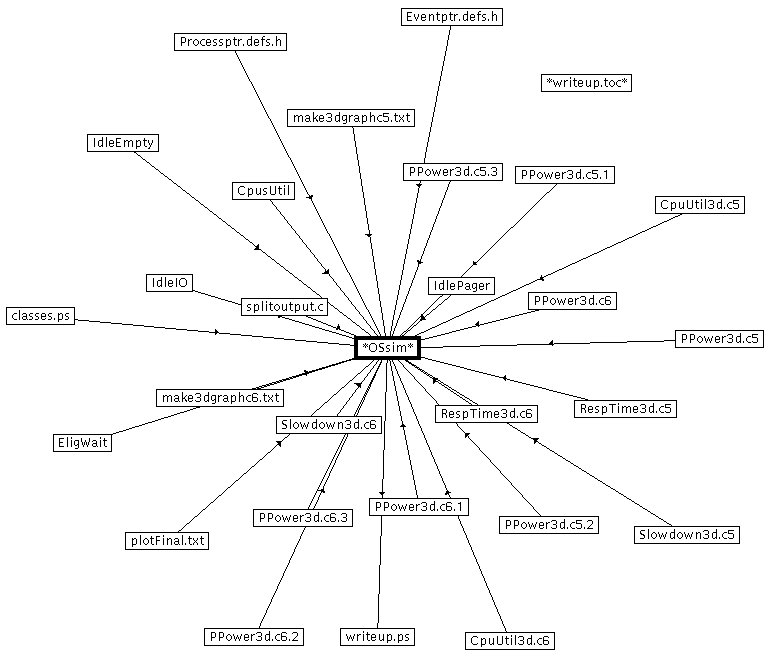
When used to control large systems, makefiles, and hence their embeddings, can become quite complicated. In Figure 9 we can see the result of simplifying such a complicated makefile by grouping vertices within distance two of the unique highest-level vertex, followed by a force-directed embedding. The resulting figure is not too complicated, and gives a clear idea of which vertices are the leaves.
We also experimented with embedding two graphs from earlier publications. In Figure 1 of Section 1.1, we showed hierarchical and force-directed embeddings of a control flow graph from Aho, Sethi and Ullman [1], (page 661, Fig. 10.45).
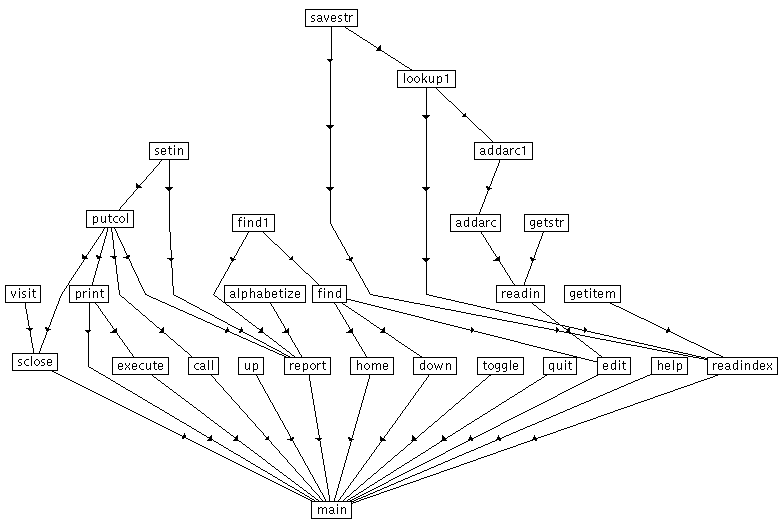
Figure 10 shows a hierarchical embedding of the running example from Rowe et al. [15]. During and after the embedding process, we can interactively assist the algorithm in eliminating edge crossing and in the layout of the graph.
The reader is encouraged to access and use our system on the Internet through the URL http://www.cs.rpi.edu/projects/pb/graphdraw/.