The Web is a constantly updating source of information. A
large number of latest developments, events and commentaries are
constantly being posted on the Web in the form of blogs, news
articles, usenet posts etc. In order to help the users avoid the
tedious task of periodically searching for updated information on
the Web, some of the search engines provide an ``alert'' service
(e.g. Google alerts [16] or
Live alerts [26]). The main
idea is to let the users create profiles (e.g. by specifying a
few query keywords) describing the information for which they
would like to receive updates. After that, the search engines are
continuously monitoring the newly collected information
from the Web and will alert the user (e.g. through email)
whenever there is new information that matches the user's
profile. In this way, the user can stay current with a developing
news story, track a good deal on a desired product or follow who
is writing about her blog.
The continuous monitoring of the Web to match a given set of
user-defined keywords, is also known as continuous
querying. Typically, the results of a continuous query can
be returned to the user either in an ``as-found'' basis or
``in-batch'' after a particular time interval (e.g. once a
day).
Although running continuous queries on the Web can potentially
help the users to stay current with important updates, in
general, the amount of information returned as updates to the
user can be ``unbounded''. For example, if the user is following
a very controversial or popular topic, she may receive hundreds
of updated pages as an alert, and may thus be overwhelmed by this
huge amount of information.
Since a user typically can allow a limited time for
comprehending the information delivered to her, one way to
alleviate this problem is to allow the user to restrict (or
bound)1 the number of returned results
within a particular time interval. More specifically, the user
may decide that, say, every day, she is interested in reading
only the 10 most relevant updates to her continuous query and
would like to receive only those updates. For the cases where it
is acceptable to return the results in-batch the solution is
straightforward: we first collect all the relevant results within
a day, we rank them and then return the top-10 to the user.
However, in the cases where the ``freshness'' of the results is
very important, and thus we need to return them as-found, the
user is not willing to wait until we collect all the relevant
results and return them at the end of the query period. For
example, if a user is tracking Web pages describing digital
cameras offered for sale, she would like to know the 10 best
pages according to some specification as soon as they appear,
since the cameras may be sold after a short period of time.
Returning the  best results in
an as-found basis to a given continuous query involves two main
challenges. First, the potentially relevant results within a time
period (e.g. a day) are not known in advance. Without knowing
all the relevant results how can we find the
top-
best results in
an as-found basis to a given continuous query involves two main
challenges. First, the potentially relevant results within a time
period (e.g. a day) are not known in advance. Without knowing
all the relevant results how can we find the
top- among them to return to the user?
Second, the points in time where the top-
among them to return to the user?
Second, the points in time where the top- relevant results will appear are also not known in advance. Given
that the freshness of results is very important, how can we
ensure that we return the top- results as
soon as they appear?
relevant results will appear are also not known in advance. Given
that the freshness of results is very important, how can we
ensure that we return the top- results as
soon as they appear?
Regarding the first challenge, clearly we will have to wait
until we see all results in order to calculate the
exact top-. However, in a
practical scenario, we may safely assume that the user is willing
to exchange some imprecision in the top-
results for a greater freshness. For example, in our digital
camera example, the user may be happy to receive the 10 deals out
of which only 9 belong to the top-10, but receive them soon
enough to actually be able to buy the products.
Given this relevance/freshness tradeoff, in this paper we
present an optimization method for bounded continuous search
queries on the Web. More specifically, our goal is to extract the
top- relevant pages that appear over a
specified time interval on the Web and return them to the user as
soon as possible. Our proposed solution utilizes principles from
the field of optimal stopping [34] in order to realize fresh, high
quality and a bounded number of search results during a specified
execution time of a continuous query. Optimal stopping is a
well-known problem in the field of financial mathematics. The
main idea of this paper is to consider the development of the
relevance of versions of Web pages as relevance charts and
to treat the problem of estimating top-k results as-found similar
to a basic problem in financial mathematics, the problem of
finding the buying or selling points for stocks at optimal
prices.
In summary, our contributions in this paper are:
- We define bounded continuous search queries as standing
search queries that extract the estimated top-k documents from
a specific Web area over a period of time. Bounded search
queries have the advantage that the amount of information
returned to a user is controlled without further user
interaction in contrast to many previous approaches in the
field of document filtering or topic tracking.
- Considering bounded continuous queries we demonstrate that
there is a tradeoff between freshness and the quality of query
results.
- We present and evaluate a new method to optimize the
retrieval quality for the cases where up-to-date information is
required by the user. The new approach is based on the optimal
stopping theory and estimates the relative ranking values of
future documents based on previous observations in a stream of
documents.
In the next section we start our discussion by presenting the
strategy that is presently employed by the current search
engines. In section ![[*]](file:/usr/share/latex2html/icons/crossref.png) we
demonstrate that in the cases where we need to obtain information
as up-to-date as possible, current approaches may return
sub-optimal results to the users. In Section we define
a new language for bounded continuous search queries and present
our optimization approach which utilizes principles from the
field of optimal stopping . Finally, in the experimental section
we
demonstrate that in the cases where we need to obtain information
as up-to-date as possible, current approaches may return
sub-optimal results to the users. In Section we define
a new language for bounded continuous search queries and present
our optimization approach which utilizes principles from the
field of optimal stopping . Finally, in the experimental section
![[*]](/www2007/file:/usr/share/latex2html/icons/crossref.png) we
verify that our new method can generate fresher and more relevant
results for a variety of continuous queries. We conclude with an
overview of related research and a summary.
we
verify that our new method can generate fresher and more relevant
results for a variety of continuous queries. We conclude with an
overview of related research and a summary.
1 Periodic Evaluation Method
In this section we give basic
definitions and present a common strategy to process bounded
continuous search queries that is applied by Web search systems
and used as a reference strategy in this paper.
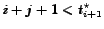
In this work we consider a simple stream of documents or versions
of a specific document
 . The index
 corresponds to the time a
document is obtained from the Web in a push or a pull manner
[21].2
corresponds to the time a
document is obtained from the Web in a push or a pull manner
[21].2
Definition:

We consider bounding conditions that are specified by the maximal
number of documents to be returned. A bounding condition provided
by a user corresponds to the maximal information load a user is
willing to accept with respect to a query. It is obvious that
threshold-based information filtering methods presented in the
field of topic tracking and detection [2] are not bounded. We consider
query profiles that are determined by a set of query terms
provided by a user. We may thereby assume that query profiles,
similar to documents, may be expressed in a term vector space.
Well-known methods from Information Retrieval may therefore be
applied to compute a distance between a query profile and a
document.
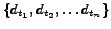
Based on the tf-idf measure [32] we may apply the
function
 |
(1) |
to compute the distance between a document  and a query profile (i.e. a set of query terms)
 [39]. In the formula the term
 (term frequency) is
the frequency of a term
(term frequency) is
the frequency of a term  in a
document . N is the number of
documents in the collection,
in a
document . N is the number of
documents in the collection,
 is the
inverse document frequency where
is the
inverse document frequency where  is the number of documents in the collection that
contain . Formula 1 is one way to estimate the relevance of a
document with respect to a query. In this paper in order to keep
our discussion more concise whenever we talk about
relevance we will use equation 1,
but in general we could use any other estimation.
is the number of documents in the collection that
contain . Formula 1 is one way to estimate the relevance of a
document with respect to a query. In this paper in order to keep
our discussion more concise whenever we talk about
relevance we will use equation 1,
but in general we could use any other estimation.
A problem of this measure is the computation of the
 term. At a specific point in
time the entire set of documents appearing in the stream is not
yet available. Possible approaches to this problem have been
presented in [38],
[18] and [31]. In this work we consider each
version of the information source or incoming document as a
single document 'collection'. The
term. At a specific point in
time the entire set of documents appearing in the stream is not
yet available. Possible approaches to this problem have been
presented in [38],
[18] and [31]. In this work we consider each
version of the information source or incoming document as a
single document 'collection'. The  -term is based only on the state of the information
source at the current point in time. If
-term is based only on the state of the information
source at the current point in time. If  is the state of the information source
 at time
  we denote the respective ranking of document
 with respect to
the query
with respect to
the query  as
as
 . As
described above in this work we make the simplifying assumption
that at each point in time a single (new) document is available.
We may therefore define
. As
described above in this work we make the simplifying assumption
that at each point in time a single (new) document is available.
We may therefore define
 and
and
 .
.
The function  is used to obtain
relevance estimations for new documents in the sequence with
respect to a query profile. In this work we simplify the search
for optimal documents by defining quality as the
estimation provided by the ranking function . Quality is used as a synonym for the relevance of
documents.
is used to obtain
relevance estimations for new documents in the sequence with
respect to a query profile. In this work we simplify the search
for optimal documents by defining quality as the
estimation provided by the ranking function . Quality is used as a synonym for the relevance of
documents.

In order to find optimal documents we have therefore simply to
find documents with the highest ranking values according to
 . This quality definition is
used because the development of estimation functions similar to
(1) is not the focus of this paper but
has been examined thoroughly in the field of information
retrieval. In this paper we show that even if an optimal
estimator for the quality of documents is given (or assumed) the
optimization of bounded continuous search queries is not a
trivial problem.
. This quality definition is
used because the development of estimation functions similar to
(1) is not the focus of this paper but
has been examined thoroughly in the field of information
retrieval. In this paper we show that even if an optimal
estimator for the quality of documents is given (or assumed) the
optimization of bounded continuous search queries is not a
trivial problem.
Based on the previous definitions we may now define a common
strategy to process bounded document filtering.

In this work we consider a PE method that applies function (1)
as the ranking or evaluation function. Obviously a PE method is a
bounded filtering method according to definition 1 due to the bounding condition,
which may e.g. imply a maximal number of pages returned in each
evaluation period or a total maximal number. In the latter case
the number of returned pages per evaluation period is determined
by (the closest integer to) the total number of documents to be
returned according to the bounding condition divided by
 , the number of evaluation
periods. A PE-query may e.g. inquire about the 'best 10' pages
each day with respect to a set of query terms, as e.g. realized
by the GoogleAlert system [16]. The PE-method is illustrated
in figure .
In the figure '
, the number of evaluation
periods. A PE-query may e.g. inquire about the 'best 10' pages
each day with respect to a set of query terms, as e.g. realized
by the GoogleAlert system [16]. The PE-method is illustrated
in figure .
In the figure ' '-symbols denote
ranking values depending on the current state of a specific data
source or a new document in a stream, a query profile and a
ranking function (as e.g. function (1)).
In this case the query execution time is
'-symbols denote
ranking values depending on the current state of a specific data
source or a new document in a stream, a query profile and a
ranking function (as e.g. function (1)).
In this case the query execution time is  . There are two evaluation periods. The
bounding condition is 4, i.e. the best two documents in each
evaluation period have to be selected and forwarded to a user as
indicated by circled ranking values.
. There are two evaluation periods. The
bounding condition is 4, i.e. the best two documents in each
evaluation period have to be selected and forwarded to a user as
indicated by circled ranking values.
2 The freshness/quality tradeoff
In this section we
demonstrate cases where the PE strategy is sub-optimal and
thereby illustrate the tradeoff-problem between freshness of
information and the quality of retrieved results.
It is obvious from figure that by
applying the PE strategy documents are returned with a certain
delay between the point in time when a document is
obtained3 and the time at the end of an
evaluation period when a document or a respective notification is
forwarded to a user. We may therefore define a freshness (or
reciprocal: delay) metric as:
where
 are the end points
of the evaluation periods (figure ). At these
points in time results are sent to a user.
are the end points
of the evaluation periods (figure ). At these
points in time results are sent to a user.  is the number of evaluation periods and
is the number of requested
(estimated best) objects.
is the number of evaluation periods and
is the number of requested
(estimated best) objects.  is
the number of optimal elements to be selected in the n-th
evaluation period (with
is
the number of optimal elements to be selected in the n-th
evaluation period (with
 ) and
) and
 is the j-th best element
selected in the n-th evaluation period.
is the j-th best element
selected in the n-th evaluation period.
It may now be shown that a PE-method is not optimal if a high
freshness is required.
Theorem 1 The PE-method may choose sub-optimal
documents if a high freshness value is required, i.e. if
 .
.
The validity of this theorem may be demonstrated by
considering the example in figure 1. If
the best documents have to be selected that appear during the
query execution time ![$[e_0, e_2]$](/www2007/test-img12.png) the optimal
strategy is to store documents and to wait until
the optimal
strategy is to store documents and to wait until  . At this point the 4 highest ranked documents may be
returned if we assume that the bounding condition implies a
number of 4 documents to be returned. However, as shown in the
example in figure 1 the delay-value as
defined above may be significant.
href="/www2007/#foot55">1 In order to acquire fresher
results, a larger number of evaluation periods has to be
considered. In figure 1 the query period
is subdivided into 2 evaluation periods. The bounding condition
in this case is 2 documents for each of the two evaluation
periods in order to fulfill the global bounding condition of
maximal 4 documents. The freshness of retrieved optimal documents
is obviously increased. However the selected documents (as
illustrated by circled '
. At this point the 4 highest ranked documents may be
returned if we assume that the bounding condition implies a
number of 4 documents to be returned. However, as shown in the
example in figure 1 the delay-value as
defined above may be significant.
href="/www2007/#foot55">1 In order to acquire fresher
results, a larger number of evaluation periods has to be
considered. In figure 1 the query period
is subdivided into 2 evaluation periods. The bounding condition
in this case is 2 documents for each of the two evaluation
periods in order to fulfill the global bounding condition of
maximal 4 documents. The freshness of retrieved optimal documents
is obviously increased. However the selected documents (as
illustrated by circled '  '-symbols) are no longer the optimal ones and
represent a suboptimal choice.
'-symbols) are no longer the optimal ones and
represent a suboptimal choice.

Figure: The PE(n) strategy: A number of
best items according to the bounding condition is returned
to a user after each of the n evaluation periods.
|
The reason for this decrease of retrieval quality is the missing
knowledge about future document rankings if objects are evaluated
at an earlier point in time. This is obviously an intrinsic
problem if the optimization of bounded continuous search queries
is concerned. There is no method that has information about
future data objects and therefore each conceivable method is
subject to this problem, which we denote as freshness/quality
tradeoff. lemmaLemma

It has to be noted that this tradeoff-problem is not valid for
threshold-based filtering methods. In the example in figure
we
wouldn't have the restriction of the maximal number of objects to
be returned and could forward each object above a specified
threshold. However in this case not knowing future ranking
values, a suboptimal threshold may be chosen, which affects
precision and recall results.
3 A query method for bounded continuous search (BCS) queries
1 The query language 'BCSQL'
In this section we describe the
main syntax of a new query language to state bounded continuous
search (BCS) queries and in subsequent sections we describe how
these queries are answered within our prototype system.
At a high level, we employ a query model similar to the OpenCQ
language [23]. In OpenCQ
a continuous query is a triple
 consisting of a
normal query (e.g. written in SQL), a
trigger condition
consisting of a
normal query (e.g. written in SQL), a
trigger condition  and a
termination criterion
and a
termination criterion  . In this work
we consider only time-based trigger conditions. We extend the
basic notation of OpenCQ in order to support continuous search
queries. For this purpose we assume the availability of a ranking
function for query results as provided by (1). A main extension with respect to many
continuous query languages is the possibility to provide a
bounding condition. In the considered query language a user has
to define the number of estimated best results to be returned.
This feature is well-known from common search engines. The best
'n' results are displayed on the first result page. A further
specific attribute is the requirement to specify a user profile
consisting of query terms. An example for the considered query
language is the following:
. In this work
we consider only time-based trigger conditions. We extend the
basic notation of OpenCQ in order to support continuous search
queries. For this purpose we assume the availability of a ranking
function for query results as provided by (1). A main extension with respect to many
continuous query languages is the possibility to provide a
bounding condition. In the considered query language a user has
to define the number of estimated best results to be returned.
This feature is well-known from common search engines. The best
'n' results are displayed on the first result page. A further
specific attribute is the requirement to specify a user profile
consisting of query terms. An example for the considered query
language is the following:
- CREATE BCSQ:
- SalesWatch as
- Query:
- SELECT ESTIMATED
 BEST
10
BEST
10
FROM SERVER www.ebay.com
WHERE query='camera 12 mega flash'
- Trigger:
- 60 minutes
- Start:
- now
- Stop:
- 7 days
- Delay:
- 0 minutes
In this query the user requests the best documents on the
server www.ebay.com over a period of 7 days with respect to the
query terms 'camera 12 mega flash'. The trigger condition in this
query language is used to define the incoming document stream in
a pull-based manner. In this example the data source is reloaded
every hour. Since the user in this example wants to buy the
respective camera, she is interested in an immediate notification
if relevant pages appear. The delay parameter (Delay=0)
indicates that results should be delivered immediately after
detection on the Web.5 By the 'BEST 10' directive she may
limit the number of irrelevant pages returned by the query
engine. The 'ESTIMATED BEST'
directive in the query denotes that, given an appropriate ranking
measure and estimation method, the query engine should estimate
and return the best documents. In general it is not known, if
versions of a data source that appear in the future have a higher
ranking and thereby declassify the current version as
(relatively) irrelevant. The current version would thereby create
'costs' in terms of information overload and a decreased
'precision', if returned to a user.
In the example the current version may contain the terms
'camera 12 mega' but a future version may contain the terms
'camera 12 mega' and 'flash' which declassifies the current
version. However if the query engine waits until all versions
have been available, the respective cameras may already be
sold.
In the following we refer to this query language as bounded
continuous search query language (BCSQL).
2 Answering queries: selecting the best k
In this section we
give an introduction into the considered optimal stopping
problem, frequently denoted as 'Secretary Selection problem'
(SSP). We first summarize results from the literature that are
the basis for the optimization method in this paper.
In the classical SSP a sequence of ranked objects is presented to
a 'player'. The player has the task to choose the best object.
The choice is based only on previous observations. The ranking
values of the objects are assumed to be distinct and equally
distributed.6 An object has to be chosen
immediately when presented to the player and may not be chosen
later. This basic problem has been analyzed e.g. in [14] and [12]. A well-known strategy for this
problem is to observe a number of candidates without choosing
them. The respective ranking values of candidates are stored.
After this observation period the first subsequent candidate is
chosen that has a higher ranking than the maximal ranking value
of the candidates in the observation period. The main problem
then is to find an optimal length of the observation period. An
optimal strategy for this problem in order to maximize the
probability of finding the best candidate is to choose an
observation period of  , where
is the number of candidates and
, where
is the number of candidates and
 is the Euler number. In
other words approximately one third of the candidates should be
observed without being chosen. This result has been proved 'in
the limit', for
is the Euler number. In
other words approximately one third of the candidates should be
observed without being chosen. This result has been proved 'in
the limit', for
 . Further
strategies for the basic SSP are discussed in [19]. Extensions of the basic SSP have
been proposed in [14] and
[30].
. Further
strategies for the basic SSP are discussed in [19]. Extensions of the basic SSP have
been proposed in [14] and
[30].
In contrast to the problem of selecting one single best
candidate, in this paper we consider the more general problem of
selecting the best candidates in a
stream of ranked documents by choices,
we denote as k-SSP. An obvious extension of the single SSP
is not to consider a single observation period (needed to adjust
the optimal selection probability) but to consider observation periods. Our method, following an
approach in [15], first
implies the choice of starting
times
 .7 After rejecting the
first
.7 After rejecting the
first
 candidates,
the first candidate considered for selection is examined at or
after time
candidates,
the first candidate considered for selection is examined at or
after time  .
.
(1) If  candidates have already been
examined with
candidates have already been
examined with  objects accepted and
 rejected, the
  object is chosen if it is at least better
than one of the objects already selected.
It is rejected if it is worse than at least one of the
objects rejected.
object is chosen if it is at least better
than one of the objects already selected.
It is rejected if it is worse than at least one of the
objects rejected.
(2) If among all the candidates examined so far the is ranked  (between the accepted and the rejected objects) it is chosen if
 and
rejected if
and
rejected if
 , where
 is the current point in
time.
is the current point in
time.
(3) If  choices have been made where
 and
and  candidates are left with respect to the entire
sequence of input candidates to be evaluated, all of the
remaining candidates must be chosen in order to guarantee that
objects are chosen.
candidates are left with respect to the entire
sequence of input candidates to be evaluated, all of the
remaining candidates must be chosen in order to guarantee that
objects are chosen.
In this paper we do not provide a proof for the previous strategy
but in the experiments the algorithm is evaluated with artificial
and real relevance sequences.

Figure: A strategy for selecting the best
two candidates in a stream of documents. Rejected
candidates are marked by rectangles, accepted candidates by
circles.
|
An example is shown in figure . We denote
the sequence of candidates as
 appearing
at times
appearing
at times
 respectively.
We consider a number of 2 candidates to be returned and two
starting points
respectively.
We consider a number of 2 candidates to be returned and two
starting points
 and
and
 . Candidates
 and
and  are rejected due to the first observation phase. Candidate
 at
at  is accepted because it is better than all of
the previously rejected candidates.
is accepted because it is better than all of
the previously rejected candidates.  is better than all the previously rejected candidates and worse
than all the previously accepted candidates. It is rejected
because it appears before the stopping time
is better than all the previously rejected candidates and worse
than all the previously accepted candidates. It is rejected
because it appears before the stopping time  . It would have been accepted if
 .
.  is accepted because it is better than at least one
previously accepted candidate. Due to the previous choice of two
candidates, candidates
is accepted because it is better than at least one
previously accepted candidate. Due to the previous choice of two
candidates, candidates  and
and  are not considered.
Based on this selection strategy the main problem is to find
optimal times
in
order to maximize the probability of choosing the best
candidates. Due to the equal
distribution of ranking values intuitively the starting times
should be spread evenly over the considered time period. In
[15] a strategy is proposed
to position starting times that is proved to be optimal and
applied in section .
In the SSP as in the BCSQL optimization
problem the candidates or versions of the data source appear
sequentially ordered one after another. There exists a definite
starting point and a definite endpoint in the BCSQL problem. In
the SSP the starting point is determined by the time of the
appearance of the first, the endpoint by the appearance of the
last candidate. The trigger condition in the BCSQL corresponds to
the considered candidates in the SSP. Each candidate is assigned
a ranking value in the SSP. In the SSP the ranking values are
assumed to be distinct. In the BCSQL problem this property
depends on the applied ranking function and may not be fulfilled
(especially if the data source did not change between 2 trigger
executions). The condition of different ranking values may be
guaranteed artificially by considering ranking values that depend
on time, i.e. versions appearing later in the sequence are
assigned a lower ranking value. In the SSP as in the CQ problem
the selection strategy may be based only on previous
observations. No information about future objects is available.
In contrast to the general BCS query language in section the delay
parameter is not adjustable if the SSP is applied to the
optimization of retrieval results. Results are returned
immediately (delay=0) if estimated to have a high ranking.
4 A query engine for BCS processing
Figure shows the
basic steps of the BCS query processing algorithm. The input of
the algorithm are the start and the end time of the continuous
query, the trigger condition, a value '' for the number of estimated best items to be chosen and
a query profile .
Based on the start, the end time and the trigger condition in
steps 1 and 2 the number of reload operations (i.e. the number of
'candidates') and the times
 of reload operations
are computed. Applying the k-SSP strategy in section the
starting times
are
computed based on the number of candidates and the number 'k' of
highly ranked candidates to be chosen. At time
of reload operations
are computed. Applying the k-SSP strategy in section the
starting times
are
computed based on the number of candidates and the number 'k' of
highly ranked candidates to be chosen. At time  the first candidate is loaded in step 7 and the
ranking with respect to the search query '' is computed (section 2.1).
The ranking is compared to previous ranking values in step 9
which are available in the list
the first candidate is loaded in step 7 and the
ranking with respect to the search query '' is computed (section 2.1).
The ranking is compared to previous ranking values in step 9
which are available in the list  and the relative ranking is computed. In step 10
it is determined if a new version is chosen as a highly ranked
candidate according to section . In figure
we assume the availability of a function isSelected(C)
that indicates, if a candidate C has been selected. In
step 11 the new candidate C is inserted into the list
rankList at the position determined by the ranking value.
If the candidate is chosen, a message is sent to the client.
Finally the algorithm waits until the time of the subsequent
reload time in step 13 and returns to step 6.
and the relative ranking is computed. In step 10
it is determined if a new version is chosen as a highly ranked
candidate according to section . In figure
we assume the availability of a function isSelected(C)
that indicates, if a candidate C has been selected. In
step 11 the new candidate C is inserted into the list
rankList at the position determined by the ranking value.
If the candidate is chosen, a message is sent to the client.
Finally the algorithm waits until the time of the subsequent
reload time in step 13 and returns to step 6.
BCS-Query-Processing (Input: start-time s, end-time e,
trigger-condition tc, 'number of best choices' k, Query Q)
- 1
- rankList := null
- 2
- compute number of candidates
 based on s,e,tc
- 3
- compute reload times
 based on s,e,tc
- 4
- compute starting times
 based on
  ,
,
- 5
- wait until

- 6
- for(i = 1,...)
- 7
- load candidate

- 8
- compute ranking
 based on
 ,
, 
- 9
- compare to previous
rankings
- 10
- select or reject
 according to
- selection strategy )
- 11
- insert
 into
rankList
into
rankList
- 12
- if( isSelected(C) ) send message to client
- 13
- wait()
4 Experiments
In the following experiments we compare the new
BCS query method to the period evaluation (PE) method. The
considered quality parameters are the freshness of the retrieved
information according to eq. () and the
quality of search results according to definition . Applying
the k-SSP method (figure ) objects
that are estimated to be relevant are returned to a user
immediately after detection on the Web.8 In this case we
assume an immediate decision of the filtering method and the
delay value in formula () is
0.
In definition we defined
the quality or relevance of a single document retrieved by a
search engine. In order to measure the quality of a set of
retrieved documents we build the sum of quality values of the
individual documents. In [20] a very similar relevance
measure is presented that is based on graded relevance
assessments (in contrast to binary relevance assessments usually
considered in IR). In [20]
the functions
for the graded recall (gr) and the graded precision
(gp) are proposed, where  denotes
the entire set of documents and relevance is a function
providing relevance values for documents, retr is the set
of retrieved documents. In the experiments we apply the same
measures and define the relevance function according to
definition .
denotes
the entire set of documents and relevance is a function
providing relevance values for documents, retr is the set
of retrieved documents. In the experiments we apply the same
measures and define the relevance function according to
definition .
In the experiments we work with simulated and real data. In the
k-SSP method a special distribution of ranking values, in
particular an equal likelihood of each new ranking value, is
assumed. Real data sometimes are not distributed like that.

Figure: Relevance evolutions of the source
'www.washingtonpost.com' over a period of 60 days with
respect to the queries 'oscar' and 'basketball'.
|
As an example, figure shows two
examples for the relevance evolution of two queries ('oscar' and
'basketball') over a period of 60 days according to the quality
definition in (1). The reason to
consider generated data in the following is to show the basic
functionality in principle. Real Web data are considered to show
that the presented filtering method based on k-SSP selection may
be applied to distributions of relevance developments of real
information.
In this
paragraph we demonstrate experiments with simulated data in order
to analyze statistical properties of the presented BCS method
compared to the PE method. The main advantage to consider
simulated data is a simple and exactly known distribution of
input data which helps to illustrate main properties of the new
method. In these experiments sequences of distinct ranking values
of candidate size  with identical
likelihoods are generated. An individual sequence is gradually
provided as an input to the BCS and PE algorithms.
with identical
likelihoods are generated. An individual sequence is gradually
provided as an input to the BCS and PE algorithms.

Figure: Dependence of the mean values of
retrieval results (graded recall and precision) on the
number of chosen best objects '.
|
In the experiment illustrated in figure a
number of 50 sequences of (distinct) ranking values (in
 ) of candidate
size
) of candidate
size  were generated. Figure
shows the respective mean values of acquired retrieval qualities
(gr and gp according to ()) for
different values of , the number of
objects to be returned. The PE strategy is applied to the data
based on a single evaluation period (PE(1)) of length 99, where
the time span between the appearance of two candidates is assumed
to be 1.9 These retrieval results are optimal
since the PE(1) method has knowledge of the whole distribution of
(previous) retrieval values. The lower graph shows the retrieval
quality of the BCS method. The graph below shows the retrieval
quality of the random method that chooses a number of arbitrary candidates. Figure shows
that the BCS method provides significantly better results than
the random strategy. As expected the quality is lower than the
quality provided by the PE(1) method which has access to the
entire set of ranking values.
In the experiment shown in
figure the
retrieval quality of the BCS strategy is lower than the retrieval
quality of the PE(1) strategy. However the BCSQL results are
returned to a user immediately while the PE(1) strategy returns
results at the end of a single evaluation period which is in this
case identical to the query period. If fresher results are
requested when using the PE method obviously a larger number of
evaluation periods has to be considered during the query
execution time. We proportion requested items to the number of evaluation periods. If
were generated. Figure
shows the respective mean values of acquired retrieval qualities
(gr and gp according to ()) for
different values of , the number of
objects to be returned. The PE strategy is applied to the data
based on a single evaluation period (PE(1)) of length 99, where
the time span between the appearance of two candidates is assumed
to be 1.9 These retrieval results are optimal
since the PE(1) method has knowledge of the whole distribution of
(previous) retrieval values. The lower graph shows the retrieval
quality of the BCS method. The graph below shows the retrieval
quality of the random method that chooses a number of arbitrary candidates. Figure shows
that the BCS method provides significantly better results than
the random strategy. As expected the quality is lower than the
quality provided by the PE(1) method which has access to the
entire set of ranking values.
In the experiment shown in
figure the
retrieval quality of the BCS strategy is lower than the retrieval
quality of the PE(1) strategy. However the BCSQL results are
returned to a user immediately while the PE(1) strategy returns
results at the end of a single evaluation period which is in this
case identical to the query period. If fresher results are
requested when using the PE method obviously a larger number of
evaluation periods has to be considered during the query
execution time. We proportion requested items to the number of evaluation periods. If
 the selected
candidates are proportioned with an equal likelood to the
evaluation periods. In the following we consider the tradeoff
between retrieval quality and freshness of data.
the selected
candidates are proportioned with an equal likelood to the
evaluation periods. In the following we consider the tradeoff
between retrieval quality and freshness of data.

Figure: Comparison of PE and BCS strategy:
the intersection (IS) of BCS and PE recall defines the
maximal number of PE intervals (evaluation periods) where
the retrieval quality of PE(n) is better than the retrieval
quality of the BCS strategy.
|
In this experiment  and
and
 . We consider the mean values
of 200 generated sequences. Figure (left)
shows the development of the graded recall for the PE(n) strategy
when the number of PE intervals is increased from 1 to N, the
number of versions over time (curve
. We consider the mean values
of 200 generated sequences. Figure (left)
shows the development of the graded recall for the PE(n) strategy
when the number of PE intervals is increased from 1 to N, the
number of versions over time (curve  ). Due to a constant k (
 in def. ()) it is
sufficient to consider the graded recall. Similar results would
have been obtained by considering the graded precision. If the
number of evaluation intervals is N, the retrieval quality of the
PE strategy (PE(N)) is obviously similar to a strategy where
candidates are selected randomly (
in def. ()) it is
sufficient to consider the graded recall. Similar results would
have been obtained by considering the graded precision. If the
number of evaluation intervals is N, the retrieval quality of the
PE strategy (PE(N)) is obviously similar to a strategy where
candidates are selected randomly ( in figure ): Since
the number of candidates is
in figure ): Since
the number of candidates is  , the
average graded recall of the random strategy is
, the
average graded recall of the random strategy is
 (according
to ()). In
figure (left)
graph
(according
to ()). In
figure (left)
graph  shows the retrieval
quality of the BCS strategy and graph
shows the retrieval
quality of the BCS strategy and graph  shows the retrieval quality of the PE strategy
when only a single evaluation period is considered (PE(1)). Both
strategies do not depend on the the number of observation periods
(x-axis).
shows the retrieval quality of the PE strategy
when only a single evaluation period is considered (PE(1)). Both
strategies do not depend on the the number of observation periods
(x-axis).
The intersection point of the fitting lines of BCS and PE(n)
strategy (IS) defines the (x-axis)-point ( in figure (left)) of
the maximal number of evaluation periods where the graded recall
of the PE strategy is better than the graded recall of the BCS
strategy. I.e. if the number of intervals is further increased
because fresher results shall be returned by the PE strategy, the
retrieval quality is lower than the retrieval quality of the BCS
method. Below the intersection point IS in figure (left) the
PE strategy therefore becomes inferior to the BCS strategy. The
BCS strategy provides maximal freshness due to an immediate
delivery of results. In this situation also the retrieval quality
is superior to the PE method in a probabilistic sense.
in figure (left)) of
the maximal number of evaluation periods where the graded recall
of the PE strategy is better than the graded recall of the BCS
strategy. I.e. if the number of intervals is further increased
because fresher results shall be returned by the PE strategy, the
retrieval quality is lower than the retrieval quality of the BCS
method. Below the intersection point IS in figure (left) the
PE strategy therefore becomes inferior to the BCS strategy. The
BCS strategy provides maximal freshness due to an immediate
delivery of results. In this situation also the retrieval quality
is superior to the PE method in a probabilistic sense.
In order to quantify this situation, in figure (right) we
consider the delay of the considered strategies according to
definition (). The data
points close to  denote
the delay of results of the PE strategy considering a single
evaluation period (PE(1)). The figure shows that results are
delivered with a delay of approximately 0.5
denote
the delay of results of the PE strategy considering a single
evaluation period (PE(1)). The figure shows that results are
delivered with a delay of approximately 0.5 50% of the entire query execution time. If e.g.
the query execution time is 40 days, results are returned with a
delay of 20 days. Curve
50% of the entire query execution time. If e.g.
the query execution time is 40 days, results are returned with a
delay of 20 days. Curve  shows the delay of the PE(n) method where the number of
evaluation periods is increased from 1 to N. Obviously the delay
converges monotonically to 0. The main point in this graph is the
y-value
shows the delay of the PE(n) method where the number of
evaluation periods is increased from 1 to N. Obviously the delay
converges monotonically to 0. The main point in this graph is the
y-value  of the PE-delay
(figure (right))
where the x value ()
corresponds to the x-value of the intersection point IS in the
figure on the left. This point marks the minimal delay of the PE
strategy where the retrieval quality is better than the retrieval
quality of the BCS strategy. In other words: If results are
requested by a user that are fresher than , a user should prefer the BCS strategy presuming
he wants to acquire maximal retrieval quality. Otherwise, if less
fresh results are sufficient, the PE strategy should be applied.
We denote as -turning point in the following. The
of the PE-delay
(figure (right))
where the x value ()
corresponds to the x-value of the intersection point IS in the
figure on the left. This point marks the minimal delay of the PE
strategy where the retrieval quality is better than the retrieval
quality of the BCS strategy. In other words: If results are
requested by a user that are fresher than , a user should prefer the BCS strategy presuming
he wants to acquire maximal retrieval quality. Otherwise, if less
fresh results are sufficient, the PE strategy should be applied.
We denote as -turning point in the following. The
 -turning point is
obtained by a local linear fit of the PE and BCS recall close to
the intersection point IS in figure (left) and
by computing the intersection point of the respective PE and BCS
fitting lines (close to
-turning point is
obtained by a local linear fit of the PE and BCS recall close to
the intersection point IS in figure (left) and
by computing the intersection point of the respective PE and BCS
fitting lines (close to  and
and  in figure , left).
Then the point
in figure , left).
Then the point  in the PE-delay
graph (the intersection of the -value and the PE-delay graph) has to be
extracted. In the example in figure (right)
BCS should be used if results are requested that are fresher than
in the PE-delay
graph (the intersection of the -value and the PE-delay graph) has to be
extracted. In the example in figure (right)
BCS should be used if results are requested that are fresher than
 3.3% of the
query execution time. If the entire query period is 40 days, the
BCS strategy should be used if results should be fresher than 1.3
days.
Figure shows the
-turning point for
different values of the number of candidates and the number of best values to be returned . It may be observed that the -turning point tends to decrease for higher
values of . The image on the right
suggests that, provided that is
sufficiently high, is
relatively constant.
3.3% of the
query execution time. If the entire query period is 40 days, the
BCS strategy should be used if results should be fresher than 1.3
days.
Figure shows the
-turning point for
different values of the number of candidates and the number of best values to be returned . It may be observed that the -turning point tends to decrease for higher
values of . The image on the right
suggests that, provided that is
sufficiently high, is
relatively constant.
2 Real information sources
In the following experiments we
applied the BCS strategy to data sources on the Web. In
particular we considered the homepages of diverse newspapers in
English or German. Before the experiments we first created a Web
archive over a period of a quarter of a year. By using a Web
crawler at regular points in time (twice a day) a mirror of the
sources was obtained and stored periodically.
Based on the obtained Web archive we extracted a number of query
terms. These query terms were the most frequent terms in the
archive not contained in the list of stop words. Thereby 480
German and 480 English query terms were extracted.
In the following experiments we considered BCS queries of the
following structure:
Query: SELECT ESTIMATED BEST
BEST  d
d
FROM PAGE url WHERE query='singleterm'
Trigger=9h and 17h, Start=now, Stop=80days
Delay= delay
delay
We applied the queries to the Web archive; the trigger condition
corresponds to the versions available in the Web archive. The
delay-parameter is 0 for the k-SSP estimation method and 80 days
for the PE(1) method (single evaluation period).
Table: Evaluation results (k=4)
|
BCS |
PE(n) |
PE(1) |
turning point |
| |
gr |
gr
depend. on maximal delay |
optimal gr |
|
| source (language) |
|
2 days |
4 days |
8 days |
12 days |
|
 (in days) (in days) |
| news.bbc.co.uk (e) |
0.387 |
0.135 |
0.246 |
0.408 |
0.506 |
0.595 |
7.9 |
| www.faz.net-s-homepage.html (g) |
0.374 |
0.107 |
0.245 |
0.354 |
0.443 |
0.548 |
8.8 |
| www.ftd.de (g) |
0.317 |
0.095 |
0.23 |
0.319 |
0.408 |
0.5 |
7.9 |
| www.latimes.com (e) |
0.24 |
0.067 |
0.104 |
0.238 |
0.3 |
0.404 |
8.4 |
| www.nytimes.com (e) |
0.231 |
0.094 |
0.159 |
0.248 |
0.321 |
0.424 |
7.4 |
| www.spiegel.de (g) |
0.326 |
0.104 |
0.167 |
0.328 |
0.404 |
0.5 |
7.5 |
| www.sueddeutsche.de (g) |
0.307 |
0.099 |
0.157 |
0.267 |
0.351 |
0.463 |
10.7 |
| www.usatoday.com-news-front.htm
(e) |
0.307 |
0.093 |
0.153 |
0.277 |
0.372 |
0.542 |
11.2 |
| www.washingtonpost.com (e) |
0.121 |
0.074 |
0.113 |
0.167 |
0.223 |
0.307 |
5.1 |
| www.welt.de-chl-20.html (g) |
0.178 |
0.057 |
0.076 |
0.155 |
0.198 |
0.296 |
10.6 |
| www.wienerzeitung.at (g) |
0.332 |
0.118 |
0.154 |
0.322 |
0.439 |
0.605 |
9.6 |
| www.zeit.de (g) |
0.276 |
0.074 |
0.134 |
0.283 |
0.361 |
0.479 |
7.5 |
| normalized mean value |
57% |
18% |
31% |
58% |
73% |
100% |
|
Table shows
a representative fraction of these experiments. The table shows
the retrieval quality (graded recall) of the BCS, the PE(j) and
the PE(1) strategy for 12 Web pages, 7 in German and 5 in
English. We consider a number of the 4 best objects to be chosen
( ). Each entry in the table
is the mean value of the respective quality parameters of all
considered (480 German and 480 English) queries. In these
experiments we specified a maximal delay of returned results of
2, 4, 8 and 12 days and adjusted the number of evaluation
intervals in the PE(j) method respectively. The table shows the
resulting graded recall (gr) values of the different
methods and the turning
point (in days) for each source.
). Each entry in the table
is the mean value of the respective quality parameters of all
considered (480 German and 480 English) queries. In these
experiments we specified a maximal delay of returned results of
2, 4, 8 and 12 days and adjusted the number of evaluation
intervals in the PE(j) method respectively. The table shows the
resulting graded recall (gr) values of the different
methods and the turning
point (in days) for each source.
As expected, the retrieval quality of the new BCS method is
smaller than the quality of the PE(1) method which is the maximal
retrieval quality with respect to the number of retrieved pages.
If a higher freshness of results is requested, the retrieval
quality of the PE(n) method decreased in the experiments. The
value (in days) in table
marks the
maximal freshness where a user obtains the best results by the
PE(n) method. Below this point the BCS strategy provides results
of a higher retrieval quality. The last row of table shows the
mean values of all data sources standardized by the maximal
recall value provided by the PE(1) strategy.
Figure shows the
-turning point for
exemplary data sources and the mean value of 14 data sources with
respect to the number of best items to be returned. The mean
value of the values (e.g. for
k=8) is approximately 7.3 days. This is 9.1% of the query
execution time of 80 days.
Query
systems are available to automate and simplify similar search
problems which are known as continuous, monitoring, notification,
alert or information dissemination services. Many publishers
provide e.g. table-of-contents or alert functions,
such as ACM Table-of-Contents Alert [1], Springer Link Alert [35] or Elsevier Contents Direct
[8]. Independent
mediating alerting services like Hermes [11] or Dias [22] provide access to
heterogeneous digital libraries.
Query languages for continuous queries are well-known in the
field of active databases [6], [5], [33]. In this field the
event-condition-action model (ECA) is used to define
standing queries to databases. Every time the event occurs, a
trigger condition is tested. The testing result may cause the
execution of the defined action. The respective information is
assumed to be structured. In many information dissemination
systems, too [9], [13], the considered query languages
concern structured or semistructured data [29], [17], [27], [9], [10], [36], [28]. In [23] and [24] continuous query languages for
information on the Web are presented that are more appropriate in
a Web context and allow e.g. the evaluation of requests to Web
forms. Although the basic syntax of the query language considered
in this paper is similar to many of the previous languages, we
focus on unstructured data, in particular documents extracted
from Web pages, similar to the approaches in [16] and [26]. The respective task to extract
relevant documents from a stream of documents is well-known from
the TREC-filtering track [31], [7], [4], [41], [37], [40], [25] and the field of topic detection
and tracking [2],
[3], [38]. In the filtering track
of the Text Retrieval Conference (TREC) [18] streams of documents are
considered. The task is to optimize methods that realize an
immediate distribution of relevant documents. A binary decision
is made to either accept or reject a document as it arrives. The
information such classifiers are based on is usually a set of
training examples, i.e. documents provided with a relevance label
and possibly a topic description. This information is used to
create a query profile which is applied to estimate the relevance
of future documents by a distance computation between the
generated query profile and a new document. The decision to
either accept a document as relevant or not is finally based on a
threshold value which may also be learned by the training
examples. In the 'adaptive' filtering track [18] the query profile or the
threshold are tuned by feedback provided by a user after the
appearance of a new document.10 Similar to the TREC filtering
track the field of topic detection and tracking (TDT) [2], [3], [38] deals with the problem
of finding relevant documents in a document stream. In this case
the classifications are based on a significantly smaller training
set and tracking (of events or topics) should start immediately,
which is more appropriate for real applications.
These previous filtering or tracking methods are usually
threshold-based [37]. The
returned information load is 'unbounded' according to definition
1. In contrast to this in
order to control the amount of information returned by a query
engine without the need of further user interaction in this paper
we consider bounded continuous search queries. Although bounded
query strategies are well-known and applied in current Web search
systems [16], [26], to our knowledge the
quality/freshness tradeoff has not been thoroughly examined for
bounded continuous search queries. Following approaches developed
in the field of optimal stopping [14], [12], [19], [15], [30], [34] we develop a new solution for
the optimization of bounded continuous search queries.
In this paper
we consider continuous search queries as a means to search for
information appearing in a specific Web area over a period of
time. Assuming a query profile and a distance measure between
profile and documents there are two basic strategies to process
continuous search queries. A first strategy is to adjust a
quality threshold in order to extract relevant documents. The
second strategy is to estimate the best 'k' documents that appear
in the document stream. In this paper we focus on the latter
query method which we denote as bounded continuous search. The
main advantages to consider bounded queries is a simple query
formulation since no threshold (except the maximal amount of
information to be returned) has to be provided. Second, there is
no risk for a user to spend too much time reviewing the documents
or to overlook important documents because of an information
overflow. On the other hand if bounded continuous search queries
are concerned there is a tradeoff between freshness and quality
of the retrieved information. In this paper we show that this
freshness/quality tradeoff may lead to suboptimal choices of
documents if very fresh information is required. We show in
experiments that in this case by applying optimal stopping theory
the quality of retrieved information may be improved
significantly.
Optimal stopping is a problem well-known in the field of
financial mathematics [34].
The results of this paper indicate that, considering
charts of the relevance of document versions, further
instruments from the field of financial mathematics may be
applied to improve continuous search queries.
- 1
- ACM Table-of-Contents Alert.
URL: http://portal.acm.org, 2006.
- 2
- J. Allan, J. Carbonell, G. Doddington, J. Yamron, and Y.
Yang.
Topic detection and tracking pilot study: Final report.
In Proc. of the DARPA Broadcast News Transcription and
Understanding Workshop, pages 194-218, 1998.
- 3
- J. Allan, R. Papka, and V. Lavrenko.
On-line new event detection and tracking.
In SIGIR '98: Proc. of the 21st annual international ACM
SIGIR conf. on Research and development in information
retrieval, pages 37-45, New York, NY, USA, 1998. ACM
Press.
- 4
- A. Arampatzis and A. van Hameran.
The score-distributional threshold optimization for adaptive
binary classification tasks.
In SIGIR '01: Proc. of the 24th annual international ACM
SIGIR conf. on Research and development in information
retrieval, pages 285-293, New York, NY, USA, 2001. ACM
Press.
- 5
- A. Arasu, S.Babu, and J.Widom.
The cql continuous query language: semantic foundations and
query execution.
VLDB J., 15(2):121-142, 2006.
- 6
- S. Babu and J.Widom.
Continuous queries over data streams.
SIGMOD Rec., 30(3):109-120, 2001.
- 7
- K. Collins-Thompson, P. Ogilvie, Y. Zhang, and J.
Callan.
Information filtering, novelty detection, and named-page
finding.
In TREC 2002. Gaithersburg, 2002.
- 8
- Elsevier contents direct.
URL: http://www.sciencedirect.com/, 2006.
- 9
- P. T. Eugster, P. A. Felber, R. Guerraoui, and A.-M.
Kermarrec.
The many faces of publish/subscribe.
ACM Comput. Surv., 35(2):114-131, 2003.
- 10
- F. Fabret, H. A. Jacobsen, F. Llirbat, J. Pereira, K. A.
Ross, and D. Shasha.
Filtering algorithms and implementation for very fast
publish/subscribe systems.
In SIGMOD '01: Proc. of the 2001 ACM SIGMOD international
conf. on Management of data, pages 115-126, New York, NY,
USA, 2001. ACM Press.
- 11
- D. Faensen, L. Faulstich, H. Schweppe, A. Hinze, and A.
Steidinger.
Hermes: a notification service for digital libraries.
In JCDL '01: Proc. of the 1st ACM/IEEE-CS joint conf. on
digital libraries, pages 373-380, New York, NY, USA, 2001.
ACM Press.
- 12
- T. Ferguson.
Who solved the secretary problem?
Statistical Science, 4(3):282-289, 1988.
- 13
- P. Foltz and S. Dumais.
Personalized information delivery: an analysis of information
filtering methods.
Commun. ACM, 35(12):51-60, 1992.
- 14
- P. Freeman.
The secretary problem and its extensions: a review.
Int. Statistical Review, 51:189-206, 1983.
- 15
- K. S. Glasser, R.Holzsager, and A. Barron.
The d choice secretary problem.
Comm. Statist. -Sequential Anal., 2(3):177-199,
1983.
- 16
- Google alert.
URL: http://www.googlealert.com, 2006.
- 17
- A. Hinze.
Efficient filtering of composite events.
In Proc. of the 20th British National Database Conf.,
2003.
- 18
- D. Hull.
The TREC 6 filtering track: Description and analysis.
In The Sixth Text Retrieval Conf. (TREC-6), pages
45-68. Gaithersburg, 1997.
- 19
- R. Kadison.
Strategies in the secretary problem.
Expo. Math., 12(2):125-144, 1994.
- 20
- J. Kekalainen and K.Jarvelin.
Using graded relevance assessments in IR evaluation.
J. of the American Society for Information Science and
Technology, 53(13), 2002.
- 21
- J. Kendall and K. Kendall.
Information delivery systems: an exploration of web pull and
push technologies.
Commun. AIS, 1(4es):1-43, 1999.
- 22
- M. Koubarakis, T. Koutris, C. Tryfonopoulos, and P.
Raftopoulou.
Information alert in distributed digital libraries: The models,
languages, and architecture of DIAS.
In ECDL '02: Proc. of the 6th European Conf. on Research
and Advanced Technology for Digital Libraries, pages
527-542, London, UK, 2002. Springer.
- 23
- L. Liu, C.Pu, and W.Tang.
Continual queries for internet scale event-driven information
delivery.
Knowledge and Data Engineering, 11(4):610-628,
1999.
- 24
- L. Liu, C.Pu, and W.Tang.
Webcq-detecting and delivering information changes on the
web.
In CIKM '00: Proc. of the 9th int. conf. on Information and
knowledge management, pages 512-519, New York, NY, USA,
2000. ACM Press.
- 25
- R.-L. Liu and W.-J. Lin.
Adaptive sampling for thresholding in document filtering and
classification.
Inf. Process. Manage., 41(4):745-758, 2005.
- 26
- Windows live alerts.
URL: http://alerts.live.com/Alerts/Default.aspx, 2006.
- 27
- G. Mühl.
Large-Scale Content-Based Publish /Subscribe
Systems.
PhD thesis, Darmstadt University of Technology, 2002.
- 28
- S. Pandey, K. Ramamritham, and S. Chakrabarti.
Monitoring the dynamic web to respond to continuous
queries.
In WWW '03: Proc. of the 12th international conf. on World
Wide Web, pages 659-668. ACM Press, 2003.
- 29
- J. Pereira, F. Fabret, F. Llirbat, R. Preotiuc-Pietro, K.
A. Ross, and D. Shasha.
Publish/subscribe on the web at extreme speed.
In VLDB, pages 627-630, 2000.
- 30
- J. Praeter.
On multiple choice secretary problems.
Mathematics of Operations Research, 19(3):597-602,
1994.
- 31
- S. Robertson and I.Soboroff.
The TREC 2002 filtering track report.
In The Eleventh Text Retrieval Conf. (TREC 2002),
2002.
- 32
- G. Salton and M.J.McGill.
Introduction to modern information retrieval.
McGraw-Hill, 1983.
- 33
- U. Schreier, H.Pirahesh, R.Agrawal, and C. Mohan.
Alert: An architecture for transforming a passive dbms into an
active dbms.
In 17th Int. Conf. on Very Large Data Bases (VLDB),
pages 469-478, 1991.
- 34
- A. Shiryaev and G.Peskir.
Optimal Stopping and Free-Boundary Problems (Lectures in
Mathematics. ETH Zürich).
Birkhauser, 2006.
- 35
- Springer link alert.
URL: http://www.springerlink.com, 2006.
- 36
- T. W. Yan and H.Garcia-Molina.
The SIFT information dissemination system.
ACM Transactions on Database Systems, 24(4):529-565,
1999.
- 37
- Y. Yang.
A study on thresholding strategies for text
categorization.
In W. B. Croft, D. J. Harper, D. H. Kraft, and J. Zobel,
editors, Proc. of SIGIR-01, 24th ACM International Conf. on
Research and Development in Information Retrieval, pages
137-145, New Orleans, US, 2001. ACM Press, New York, US.
- 38
- Y. Yang, T. Pierce, and J. Carbonell.
A study of retrospective and on-line event detection.
In SIGIR '98: Proc. of the 21st annual international ACM
SIGIR conf. on Research and development in information
retrieval, pages 28-36, New York, NY, USA, 1998. ACM
Press.
- 39
- B. Yuwono, S. L. Y. Lam, J. H. Ying, and D. L. Lee.
A World Wide Web resource discovery system.
In In Fourth International World Wide Web Conf.,
Boston, pages 145-158, 1995.
- 40
- C. Zhai, P.Jansen, E.Stoica, N.Grot, and D.A.Evans.
Threshold calibration in CLARIT adaptive filtering.
In Text REtrieval Conf. 1998, pages 96-103, 1998.
- 41
- Y. Zhang and J. Callan.
Maximum likelihood estimation for filtering thresholds.
In SIGIR '01: Proc. of the 24th annual international ACM
SIGIR conf. on Research and development in information
retrieval, pages 294-302, New York, NY, USA, 2001. ACM
Press.
Footnotes
- 1
- A bounded information load is very familiar to users with
respect to other media like television or magazines. Newscasts
and other transmissions on television typically take a
well-defined amount of time.
- 2
- The extension to a stream of document-sets consisting of
 documents respectively
 ,
where
,
where  is a set of (new)
documents
is a set of (new)
documents
 , is not
the focus of this paper. In this case the applied information
retrieval measures presented here have to be modified as
described e.g. in [38].
, is not
the focus of this paper. In this case the applied information
retrieval measures presented here have to be modified as
described e.g. in [38].
- 3
- We consider the time needed to compute a ranking value
negligible. Therefore the time a document is obtained
corresponds to the x-axis values of ''-symbols in figure .
- 4
- Obviously by this method results are returned with a delay
of 50% of the query execution time on average assuming equally
distributed ranking values.
- 5
- If 'Delay = 1 week' obviously the optimal objects may be
selected (at the end of the week). If however Delay 1 week, usually only a
suboptimal choice is possible.
- 6
- If
 denotes the
ranking position of object
denotes the
ranking position of object  with
respect to objects
with
respect to objects
 , then the
independence assumption is
, then the
independence assumption is
 ,
,
 .
.
- 7
- We consider discrete times. If e.g.
 candidates have been rejected and accepted we are at time
  . A rank of '1' marks the best object.
- 8
- We ignore the time to perform the relevance estimation.
Objects that are rejected due to the learning period of the
filter affect the quality but not freshness value.
- 9
- Considering PE(1) there is a slight decrease of the graded
precision for increasing -value
due to definition ().
- 10
- On-line feedback may be simulated by successive revealing
of training data.


