| Alg. | Description | Alg. | Description |
|---|---|---|---|
| B | BHITS | WB | WBHITS |
| CB | Combination of BHITS and CDR | WCB | Combination of WBHITS and CDR |
| OB | Combination of BHITS and Okapi | WOB | Combination of WBHITS and Okapi |
| TB | Combination of BHITS and TLS | WTB | Combination of WBHITS and TLS |
| VB | Combination of BHITS and VSM | WVB | Combination of WBHITS and VSM |
| Query | Links | HITS-based Algorithm | ||||||||||
| B | WB | CB | OB | TB | VB | WCB | WOB | WTB | WVB | |||
| 1 | VC | 2065 | 6.9 | 5.95 | 7.5 | 7.5 | 7.35 | 7.05 | 7.4 | 7.4 | 7.4 | 6.0 |
| 2 | RE | 912 | 4.95 | 7.55 | 7.9 | 7.25 | 7.7 | 6.15 | 7.9 | 7.25 | 7.7 | 6.15 |
| 3 | ZB | 2017 | 8.5 | 8.5 | 8.45 | 8.35 | 8.55 | 8.55 | 8.9 | 8.7 | 8.65 | 8.5 |
| 4 | TH | 2634 | 6.7 | 6.95 | 7.55 | 7.6 | 7.75 | 6.05 | 7.95 | 7.95 | 7.65 | 8.0 |
| 5 | PA | 2645 | 8.25 | 8.25 | 8.5 | 8.45 | 8.45 | 8.25 | 8.5 | 8.4 | 8.4 | 8.15 |
| 6 | SC | 1994 | 8.45 | 8.45 | 8.6 | 8.45 | 8.45 | 8.45 | 8.6 | 8.45 | 8.45 | 8.45 |
| 7 | TE | 1958 | 8.5 | 8.5 | 8.6 | 8.5 | 8.7 | 8.7 | 8.5 | 8.4 | 8.4 | 8.4 |
| 8 | SU | 2068 | 3.15 | 7.95 | 8.25 | 8.2 | 8.25 | 8.25 | 8.25 | 8.2 | 8.25 | 8.25 |
| 9 | AL | 2299 | 7.95 | 8.75 | 8.25 | 8.7 | 8.35 | 8.35 | 8.7 | 8.75 | 8.75 | 8.75 |
| 10 | CG | 2060 | 9.5 | 9.5 | 9.6 | 9.7 | 9.7 | 9.7 | 9.6 | 9.7 | 9.7 | 9.7 |
| 11 | LD | 2243 | 8.5 | 8.85 | 8.7 | 8.8 | 8.2 | 8.25 | 8.9 | 8.65 | 8.8 | 8.9 |
| 12 | BI | 2534 | 7.2 | 7.7 | 8.7 | 8.4 | 8.5 | 8.5 | 8.7 | 8.35 | 8.6 | 8.6 |
| 13 | FH | 1453 | 7.9 | 7.45 | 7.8 | 7.8 | 7.8 | 7.8 | 7.8 | 7.8 | 7.8 | 7.8 |
| 14 | AP | 1732 | 8.5 | 8.5 | 8.5 | 8.5 | 8.5 | 8.5 | 8.5 | 8.5 | 8.5 | 8.5 |
| 15 | TT | 1499 | 8.0 | 8.0 | 8.25 | 7.65 | 7.6 | 7.55 | 8.6 | 8.7 | 8.65 | 8.65 |
| 16 | RC | 2049 | 7.9 | 7.9 | 7.55 | 8.05 | 8.0 | 7.65 | 7.55 | 8.05 | 8.0 | 7.65 |
| 17 | CV | 3589 | 6.0 | 8.25 | 8.25 | 8.25 | 8.25 | 8.25 | 8.25 | 8.25 | 8.25 | 8.25 |
| 18 | SH | 2909 | 8.4 | 8.4 | 8.1 | 8.45 | 8.45 | 8.45 | 8.1 | 8.65 | 8.65 | 8.65 |
| 19 | CR | 2608 | 3.45 | 7.2 | 7.5 | 7.45 | 7.45 | 7.45 | 7.5 | 7.35 | 7.3 | 7.3 |
| 20 | GW | 1806 | 7.3 | 7.95 | 8.3 | 8.3 | 8.3 | 8.3 | 8.45 | 8.1 | 8.1 | 8.4 |
| 21 | GA | 3459 | 7.95 | 8.55 | 8.4 | 8.65 | 8.8 | 8.8 | 9.0 | 8.75 | 8.8 | 8.8 |
| 22 | CH | 2336 | 8.15 | 8.15 | 8.2 | 8.2 | 8.25 | 8.25 | 8.2 | 8.2 | 8.2 | 8.2 |
| 23 | HI | 3028 | 7.2 | 8.75 | 8.8 | 8.7 | 8.7 | 8.7 | 8.8 | 8.7 | 8.7 | 8.7 |
| 24 | AA | 1425 | 7.75 | 8.25 | 8.6 | 8.6 | 8.65 | 8.65 | 8.4 | 8.4 | 8.25 | 8.35 |
| 25 | MF | 3357 | 7.55 | 8.3 | 8.8 | 8.4 | 7.9 | 8.1 | 8.25 | 8.4 | 8.35 | 8.4 |
| 26 | BL | 4037 | 4.05 | 7.95 | 8.65 | 7.55 | 8.15 | 8.15 | 8.8 | 8.45 | 8.25 | 8.25 |
| 27 | GD | 2818 | 8.0 | 8.0 | 8.0 | 8.05 | 8.05 | 8.05 | 8.0 | 8.05 | 8.05 | 8.05 |
| 28 | AR | 3322 | 8.25 | 8.6 | 8.15 | 8.5 | 8.15 | 8.15 | 8.45 | 8.45 | 8.45 | 8.45 |
Duplicates or intra-domain links are then removed. For a link in either in-link set or out-link set of a root link, (1) it is considered a duplicate if it has the same name as another link in the same set, whether they are in lower case or not; (2) it is an intra-domain link if it is on the same domain as the root link. If two links only differ in that one ends with index.html, index.htm, home.htm, or home.html, while the other does not, they are considered duplicates. In addition, if two links are the same except that one begins with www and the other does not, they are also regarded duplicates. For example, link http://www.zenki.com/ and link http://zenki.com/ are duplicates.
Table 3 shows the base sets for the various queries. The number of distinct links in these sets ranges from 912 to 4037. The average in-degree and out-degree of a base-set link are 31 and 14, respectively, and about 43% of base-set links have 50 in-links. These sets of links are used for the BHITS algorithm or WBHITS algorithm. Let's call these sets of links set 1.
Another sets of links, called set 2, were generated from set 1 by further reducing the number of links. Each link is followed to evaluate its relevance to the query. We first remove broken links. If two links have the same document length and the same relevance score using the relevance scoring methods, they are considered duplicates, and one of them is discarded if they are in the same in-link set or out-link set of a root link. Set 2 were used by the methods combining BHITS algorithm or WBHITS algorithm with one of the four scoring methods.
Table 2 lists the 10 HITS-based algorithms used in the experiments. They are five unweighted algorithms and five weighted algorithms. The five unweighted algorithms are BHITS and its combination with one of the four relevance scoring methods. The five weighted algorithms include our weighted BHITS and its combination with one of the four relevance scoring methods.
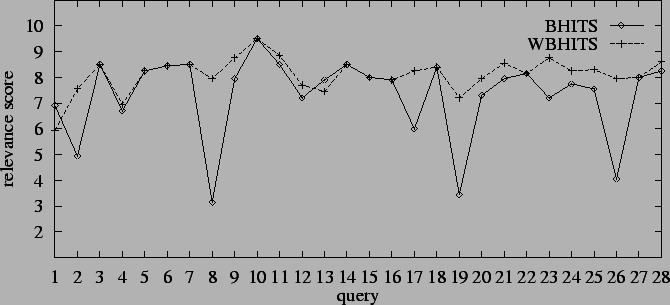 |
The average relevance scores of BHITS and WBHITS on 28 queries is plotted
in Fig. 1, which clearly demonstrates
that WBHITS remarkably improves BHITS. In our experiments, we notice that
small-in-large-out
links are very common in the base sets of queries, and we find small-in-large-out
links in all the 28 queries except query 5, 15, 16, and 18. WBHITS shows
good job on almost all the queries with
small-in-large-out links
except that the relevance scores are slightly worse than those of BHITS
algorithm for queries 1 and 13. Especially, WBHITS gets significant improvement
over BHITS on queries 2, 8, 17, 19, and 26 by preventing the results from
converging to small-in-large-out links.
| B | WB | CB | OB | TB | VB | WCB | WOB | WTB | WVB | |
| B | 0.0 | -18.3 | -21.7 | -20.3 | -20.7 | -18.3 | -22.7 | -21.5 | -21.6 | -19.8 |
| WB | 18.3 | 0.0 | -2.7 | -2.0 | -2.1 | -0.1 | -3.6 | -2.9 | -2.9 | -1.5 |
| CB | 21.7 | 2.7 | 0.0 | 0.7 | 0.7 | 2.9 | -0.9 | -0.3 | -0.3 | 1.5 |
| OB | 20.3 | 2.0 | -0.7 | 0.0 | 0.0 | 2.2 | -1.7 | -0.9 | -1.0 | 0.8 |
| TB | 20.7 | 2.1 | -0.7 | 0.0 | 0.0 | 2.2 | -1.6 | -0.9 | -1.0 | 0.8 |
| VB | 18.3 | 0.1 | -2.9 | -2.2 | -2.2 | 0.0 | -3.9 | -3.1 | -3.2 | -1.7 |
| WCB | 22.7 | 3.6 | 0.9 | 1.7 | 1.6 | 3.9 | 0.0 | 0.7 | 0.7 | 2.4 |
| WOB | 21.5 | 2.9 | 0.3 | 0.9 | 0.9 | 3.1 | -0.7 | 0.0 | 0.0 | 1.6 |
| WTB | 21.6 | 2.9 | 0.3 | 1.0 | 1.0 | 3.2 | -0.7 | 0.0 | 0.0 | 1.7 |
| WVB | 19.8 | 1.5 | -1.5 | -0.8 | -0.8 | 1.7 | -2.4 | -1.6 | -1.7 | 0.0 |
Table 4 presents the average improvement/degradation
(%) of relevance scores between two algorithms. It shows that the combinations
of BHITS/WBHITS algorithm with a relevance scoring method outperform BHITS
algorithm, with improvement ranging from 18.3% to 22.7%. For example, WB
improves the relevance scores of B by 18.3%. The improvement of
CB,
OB,
TB, and VB over WB is marginal, ranging from 0.1%
to 2.7%. The improvement of WCB, WOB, WTB, and WVB
over CB, OB, TB, and VB is 0.9%, 0.9%, 1.0%,
and 1.7% respectively, which tells us that a weighted in-link approach
has little effect on the BHITS algorithm when both of them combine content
analysis. Table 4 shows that the combination
of BHITS algorithm with any of the four scoring methods has comparable
performance, with CDR the best and VSM the worst. The best
algorithm CB improves OB, TB, and
VB
by only
0.7%, 0.7%, and 2.9%, WCB improves WOB,WTB, and
WVB by
only 0.7%, 00.7%, and 2.4%, respectively.
| Statistical | Statistical Comparison of a Pair of HITS-Based Algorithms | ||||||
| Method | WBvB | CBvOB | CBvTB | CBvVB | OBvTB | OBvVB | TBvVB |
| EL | 0.0 | 0.007 | 0.005 | 0.001 | 0.017 | 0.001 | 0.001 |
| PAC | 0.999 | 0.941 | 0.964 | 0.995 | 0.878 | 0.993 | 0.989 |
Besides the improvement of average relevance scores between two algorithms, we compare the performance of different algorithms using two statistical metrics: expected loss (EL) [4] and probably approximately correct (PAC) [5]. We set the confident level 0.95 for PAC and the loss threshold 0.05 for EL. The results are shown in Table 5. Both metrics give consistent results: WB is better than B; CB is the best and VB is the worst among the four algorithms combined with relevance scoring methods; and OB better than TB, although two PAC values are a little below the confident level.