 |
aDIGITAL,
Systems Research Center,
130 Lytton Avenue,
Palo Alto, CA 94301, U.S.A.
bharat@pa.dec.com,
broder@pa.dec.com,
monika@pa.dec.com, and
pkumar@pa.dec.com
bComputer Science Department,
Stanford University,
Palo Alto, CA 94301, U.S.A.
suresh@cs.stanford.edu
In an attempt to alleviate this problem we have built a server, called the Connectivity Server, that provides linkage information for all pages indexed by the AltaVista search engine. In its basic operation, the server accepts a query consisting of a set L of one or more URLs and returns a list of all pages that point to pages in L (predecessors) and a list of all pages that are pointed to from pages in L (successors). More generally the server can produce the entire neighbourhood (in the graph theory sense) of L up to a given distance and can include information about all the links that exist among pages in the neighbourhood.
Although some of this information can be retrieved directly from Alta Vista or other search engines, the search engines are not optimized for this purpose and the process of constructing the neighbourhood of a given set of pages is slow and laborious. In contrast our prototype server needs less than 0.1 ms per result URL.
To test our prototype we have built two applications, described further below. One is a simple direct interface that allows a user to navigate the Web by determining quickly all predecessors and successors of a given page. The other is a visualization tool for the neighbourhood of a given set of pages.
Using a server to provide linkage information to interested clients has many more potential applications. Some examples of current research projects or commercial software that use linkage information are:
We represent the Web as a graph consisting of nodes and directed edges. Each node represents a page and a directed edge from node A to node B means that page A contains a link to page B.
The set of nodes is stored in an array, each element of the array representing a node. The array index of a node element is the node's ID. We represent the set of edges emanating from a node as an adjacency list, that is for each node we maintain a list of its successors. In addition, for each node we also maintain an inverted adjacency list, that is a list of nodes from which this node is directly accessible, namely its predecessors. Therefore a directed edge from node A to node B appears twice in our graph representation, in the adjacency list of A and the inverted adjacency list of B. This redundancy in representing edges simplifies both forward and backward traversal of edges. To minimize fragmentation, elements of all adjacency lists are stored together in one array called the Outlist. Similarly elements of all inverted adjacency lists are stored in another array called the Inlist. The adjacency and inverted adjacency lists stored in each node are represented as offsets into the Outlist and Inlist arrays respectively. The end of the adjacency list for a node is marked by an entry whose high order bit is set (see Fig. 1) Thus we can determine the predecessors and the successors of any node very quickly.
|
After a full crawl of the Web, all the URLs that are to be represented in the server are sorted lexicographically. The index of a URL in this sorted list is its initial ID (see the discussion of updates below). Then the list of sorted URLs is stored as a delta-encoded text file, that is, each entry is stored as the difference (delta) between the current and previous URL. Since the common prefix between two URLs from the same server is often quite long, this scheme reduces the storage requirements significantly. With the 100 million URLs in our prototype we have seen a 70% reduction in size (see Fig. 2)
This reduction in storage requirements comes at a price, namely the slowdown of the translation. In order to convert a delta encoded entry back to its complete URL, one needs to start at the first URL and apply all the deltas in sequence until arriving at the URL in question. We avoid this problem by periodically storing the entire URL instead of the delta encoding. This entry is called a checkpoint URL. Therefore to translate a delta encoded URL, we need to apply the deltas starting from the last checkpoint URL rather than the first URL. The cost of the translation can be reduced by increasing the checkpoint frequency (see Fig. 3) To translate a URL to an internal ID we first search the sorted list of checkpoint URLs to find the closest checkpoint. Then the delta encoded list is searched linearly from that checkpoint URL until the relevant URL is reached. To speed up the the reverse translation from internal ID to an URL, the relevant node points directly to the closest checkpoint URL. As before the URL is computed by searching linearly from the checkpoint URL.
 |
 |
To allow for additions, we allocate initially larger tables than immediately necessary. For newly added nodes, we maintain a separate structure for the URL to id translation, organized as a string search tree. This tree contains all the newly added nodes and their assigned ID's in the main data structure. To update the Outlist table, the list of new edges is grouped by source. If the new Outlist associated to a node is longer than the old Outlist, space is allocated at the end of the current Outlist table. The update of the Inlist table is done similarly, except that edges are sorted by destination. Eventually the wasted gaps in tables consume too much space, and/or the additional node tree becomes too large and then the entire structure is rebuilt.
 |
The simple query interface (shown in Fig. 5) allows the user to type in a URL and provides three buttons: one to retrieve the predecessors (left arrow), one to retrieve the successors (right arrow), and one to retrieve both sets of neighbours (double arrow).
 |
 |
The advanced query interface (see Fig. 7) gives the user more options. The user can specify:
 |
Figure 8 shows a tree-view display for the advanced
query in Fig. 7. Two incoming and two outgoing edges
are considered for each URL to compute a neighbourhood of radius two. For example,
www.digital.com is a distance-1 neighbour of www.research.digital.com/SRC/
and www.altavista.digital.com is a distance-1 neighbour of www.digital.com.
 |
 |
 |
| Fig. 9. The sets comprising the Neighbourhood Graph and their layout. | Fig. 10. The old setup for building the Neighbourhood Graph. |
We make some modifications to the Neighbourhood Graph for our application. Edges between pages on the same host are first removed from the graph. Any nodes in the resulting graph that have no incoming or outgoing links are removed as well.
After the above filtering, for Start Sets of size 200 and with in-degree restricted to 50, the average Back Set size was about 180 and the average Forward Set size was about 970. It took on the order of two hours to construct the graph.
In our new implementation, we use the Connectivity Server as follows: The application gives the Start Set URLs to the Connectivity Server, which returns an adjacency list for the unfiltered Neighbourhood Graph. This takes under a minute. Since filtering takes in the order of a few seconds, the second implementation is two orders of magnitude faster.
A user query is translated into an AltaVista query. The top 200 results from AltaVista form the Start Set, from which the Neighbourhood Graph is built, as described above. There are two scores associated with each page: a hub score, H, and an authority score, A. Initially all scores are set to 1. Then the following steps are iteratively executed until the scores converge:
As shown by Kleinberg, the nodes with large A values are likely to be good authority pages, and the nodes with large H values are likely to be good hubs. The computation converges to a stable ranking of scores in about 10 iterations. We compute 150 iterations which takes about 2 minutes.
Our visualization consists of several interactive views which are synchronized. Selecting a page in one view causes all the other views to update to the selected page as well. The figures below show a visualization of the neighbourhood graph for the result set of the AltaVista query: bosnia.
The first view is the List View that lists the elements of the three sets textually and shows incoming and outgoing edges of the current selection (see Fig. 11). For brevity URL names are sometimes abbreviated to shorter labels computed by concatenating the most significant part of the host name and a unique identifier (e.g., "utexas 289"). The same naming scheme is used to identify pages in other views as well whenever space is limited.
 |
The Graph View (see Fig. 12) displays the connectivity between pages graphically. Each page is represented by a rectangular icon, and edges are drawn as straight lines between pairs of page icons. The direction of the edge is usually not displayed unless one of the nodes is selected. If a node is selected, all incident edges are highlighted. An edge is highlighted in black at the source node and in yellow at the sink node. With each node's icon its computed attributes are represented by a pair of red and green colour-coded boxes. The larger the attribute the greater is the intensity of the box's colour. In the Kleinberg application, we use the red box represents the page's authority score, and the green box represents the hub score.
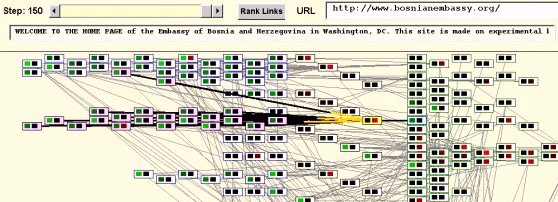 |
At the top of the window we have a Step control to view the state of the computation at various iterations. For any given iteration, the "Rank Links" button brings up the Ranked Pages View which shows rankings of pages based on various attributes. Finally, for a selected page the URL and the first few words on the page (available if the page was actually fetched) are displayed.
The Ranked Pages View (see Fig. 13) displays various rankings of pages based on the ranking analysis algorithm being used. Currently we rank the nodes according to the authority and hub scores computed by Kleinberg's algorithm. Hence, there are two ranked lists. Double-clicking on a listing in the Ranked Pages View causes the corresponding page to be loaded into a browser window.
 |
For example, the best hub and authority
by the ranking in the above figure are
"http://reenic.utexas.edu/reenic/Countries/Bosnia_and_Herzegovina/bosnia_and_herzegovina.html" and
"http://www.cco.caltech.edu/~bosnia/bosnia.html", respectively. In this case the best hub and the best authority appear to be considerably
more relevant than the places highly ranked by various search engines that
we tried with the same query.
 Krishna Bharat is a member of the research staff at Digital Equipment
Corporation's Systems Research Center. His research interests include
Web content discovery and retrieval, user interface issues in automating
tasks on the Web and speech interaction with hand-held devices. He received
his Ph.D. in Computer Science from Georgia Institute of Technology in 1996,
where he worked on tool and infrastructure support for building distributed
user interface applications.
Krishna Bharat is a member of the research staff at Digital Equipment
Corporation's Systems Research Center. His research interests include
Web content discovery and retrieval, user interface issues in automating
tasks on the Web and speech interaction with hand-held devices. He received
his Ph.D. in Computer Science from Georgia Institute of Technology in 1996,
where he worked on tool and infrastructure support for building distributed
user interface applications.
|
 Andrei Broder
has a B.Sc. from Technion, Israel Institute of Technology
and a M.Sc. and Ph.D. in Computer Science from Stanford University.
He is a member of the research staff at Digital Equipment Corporation's
Systems Research Center in Palo Alto, California. His main interests
are the design, analysis, and implementation of probabilistic algorithms
and supporting data structures, in particular in the context of Web-scale
applications.
Andrei Broder
has a B.Sc. from Technion, Israel Institute of Technology
and a M.Sc. and Ph.D. in Computer Science from Stanford University.
He is a member of the research staff at Digital Equipment Corporation's
Systems Research Center in Palo Alto, California. His main interests
are the design, analysis, and implementation of probabilistic algorithms
and supporting data structures, in particular in the context of Web-scale
applications.
|
 Monika R. Henzinger
received her Ph.D. from Princeton University in 1993 under
the supervision of Robert E. Tarjan. Afterwards, she was an assistant professor
in Computer Science at Cornell University. She joined the Digital Systems
Research Center in 1996. Her current research interests are information
retrieval on the Web, efficient algorithms and data structures, and program
performance monitoring.
Monika R. Henzinger
received her Ph.D. from Princeton University in 1993 under
the supervision of Robert E. Tarjan. Afterwards, she was an assistant professor
in Computer Science at Cornell University. She joined the Digital Systems
Research Center in 1996. Her current research interests are information
retrieval on the Web, efficient algorithms and data structures, and program
performance monitoring.
|
 Puneet Kumar
received his Ph.D. from Carnegie Mellon University in
1994. Afterwards, he joined the Digital Equipment Corporation's Systems
Research Center as a member of the research staff. His current research
interests are information retrieval on the Web, Internet appliances, compilers
and file systems.
Puneet Kumar
received his Ph.D. from Carnegie Mellon University in
1994. Afterwards, he joined the Digital Equipment Corporation's Systems
Research Center as a member of the research staff. His current research
interests are information retrieval on the Web, Internet appliances, compilers
and file systems.
|
| Suresh Venkatasubramanian is a Ph.D. Candidate in Computer Science at Stanford University working under the direction of Professors Rajeev Motwani and Jean-Claude Latombe. His research interests are in algorithm design/analysis, combinatorial geometry, and graph theory. |