 Fifth International World Wide Web Conference
May 6-10, 1996, Paris, France
An Investigation of Documents from the World Wide Web
Allison Woodruff
Paul M. Aoki
Eric Brewer
Paul Gauthier
Lawrence A. Rowe
Computer Science Division
University of California at Berkeley
Berkeley, CA
94720-1776
email: {woodruff,aoki,brewer,gauthier,rowe}@cs.berkeley.edu
- Abstract:
-
We report on our examination of pages from the World Wide Web. We
have analyzed data collected by the Inktomi Web crawler (this data
currently comprises over 2.6 million HTML documents). We have
examined many characteristics of these documents, including: document
size; number and types of tags, attributes, file extensions,
protocols, and ports; the number of in-links; and the ratio of
document size to the number of tags and attributes. For a more
limited set of documents, we have examined the following: the number
and types of syntax errors and readability scores. These data have
been aggregated to create a number of ranked lists, e.g., the ten
most-used tags, the ten most common HTML errors.
- Keywords:
-
HTML, statistics, tools, World Wide Web.


Introduction
We report the results of an extensive analysis of HTML documents from
the World Wide Web. Our data set, collected by the Inktomi Web crawler, currently
comprises over 2.6
million HTML documents. We present a broad range of statistics
pertaining to these pages.
Such an analysis of the content of HTML documents is of interest for
several reasons:
- Evolution of HTML. Unused features and extensions that do
not achieve a reasonable level of acceptance should be deprecated and,
eventually, eliminated. This prevents the accretion of useless
language features.
- Improving Web content. Widespread awareness of poor
natural and markup language usage will promote the spread of helpful
tools and practices.
- Control of HTML. The marketplace perceives the relative
ability of vendors to force acceptance of new, non-standard language
extensions as market ``strength.'' Understanding the true acceptance
level of such extensions can help fight vendor disinformation.
- Sociological insights. Many interesting sociological
observations may be derived from the content of Web pages.
Despite these motivations, however, previous studies relating
to the Web have either focused on other topics or have been
limited in scope. The most closely related work includes:
- User studies.
User surveys
[COMM95,
PITK94b,
PITK95a,
PITK95b,
RISS95,
YAHO95]
and browser usage studies
[CATL95,
PITK94a]
have become very common. Such studies
focus on high-level user issues (e.g., choice of software, available
connectivity) and low-level user-browser interaction (e.g., use of the
back button). The information extracted, though valuable, is
wholly user-centric.
- Content analyses of small data sets.
There have been some attempts to perform simple analyses of the
content of the Web. For example, the original Lycos
project at Carnegie Mellon University's Center for Machine Translation
[MAUL94]
tracked a number of interesting statistics while
their data set was relatively small. These included:
- content of title and headings
- 100 top keywords and first 20 lines
- word frequency count
- file size (bytes, words)
- URL types
- most-linked-to URLs
- Structural analysis.
The CMU Lycos project generated at least one complete graph
of their data set. The project's commercial successor, Lycos, Inc.,
now tracks the 250 most-linked-to sites as a side-effect of their
indexing [LYCO95].
Other projects have focused on (graph-oriented)
structural analysis as well.
These include several Web visualization systems (e.g., Webspace
[CHI95]
and the Navigational View Builder
[MUKH95]).
For the most part, such visualization
has been very small-scale and limited in scope.
More sophisticated analyses are possible, combining both structural
analysis and semantic modelling. A project at Xerox PARC
[PIRO95] is
conducting such analyses over small data sets.
To complement the above work,
we have conducted a large-scale investigation of the
content of HTML documents from the
Web. The remainder of this paper is structured as follows.
First, we describe the tools we used to perform our study.
We next discuss the scope of our study and our results.
Finally, we present some lessons learned and
possible future directions.
Tools
The tools used to perform the data collection and data analysis for
this study represent the integration of software from a variety of
sources. Specifically, we have developed or adapted software
to perform the following tasks:
We discuss each set of tools in turn.
Web Data Collection
The Inktomi research
project at Berkeley, consisting of Prof. Eric Brewer and graduate
student Paul Gauthier, conducts research in the construction of scalable Web
servers using parallel processing technology. To date, the
project has produced two major software components: a parallel Web
crawler and a parallel Web index search engine. In this paper,
where we mention Inktomi, it may be assumed that we refer to the crawler.
The data presented in this study comes entirely from Inktomi. The
high speed of the crawler enables us, for the first time, to consider
taking ``snapshots'' of the Web and analyzing them. As of this
writing, the Inktomi team has crawled twice. The first set of runs,
from July to October 1995, collected 1.3 million unique HTML documents.
The second set of runs, in November 1995, collected 2.6 million
unique HTML documents.
HTML Data Extraction and Manipulation: libink
Although toolkits such as the W3C Reference Library [FRYS94] already exist for manipulating HTML and
HTTP objects, we have developed our own special-purpose library,
libink. This was necessitated by the fact that our
performance and functionality needs were very different from those of
the other toolkit developers.
libink consists of four major subcomponents:
- HTML parser. libink contains a simple
flex-based HTML scanner. We found existing parsers too slow
(especially true in the case of parsers written in scripting
languages) or difficult to modify. The libink scanner is
small, enabling us to make it both fast and relatively robust, as well
as highly configurable. Like the W3C SGML/HTML lexical analyzer [CONN95], our scanner uses a callback interface to
handle various events (e.g., recognition of a tag and its attributes).
The W3C lexical analyzer, however, is not configurable.
- URL parser. The URL parser, unlike many freely-available
implementations, conforms to RFC 1808 [FIEL95].
- Domain name service (DNS) translation and caching. We use
Internet addresses to reduce hostname aliasing in our data. To speed
up the lookup process, we provide a wrapper around the standard name
service routines that caches all URL hostnames.
- General hash table services. The various lookup tables on
which libink relies sometimes exceed the capacity of a single
machine's physical memory. Therefore, in addition to in-memory hash
tables, libink provides interfaces to striped on-disk hash
tables (using GNU DBM) as well as hash-partitioned distributed hash
tables (using ONC RPC). The distributed hash tables support 1ms
turnaround on hash table lookups, which is far better than the 20-30ms
required to fetch a hash table page from secondary storage.
Natural Language Analysis: style
We scored English language documents using the standard UNIX
style program [CHER81]. style
reports a variety of statistical properties of each document, such as
the average sentence length and the number of complex sentences. It
also scores the document using four readability metrics. These
metrics indicate the nominal educational (grade) level a reader would
need to understand the document.
Since most HTML documents do not conform to an internationalization
standard, we applied heuristics to screen out non-English documents.
We filtered out documents that contained any character with
the high bit set (indicating a non-ASCII character set) or containing
character sequences indicating known encodings (such as the Shift-JIS
encoding of the Japanese character set).
Markup Language Analysis: weblint
We scored documents using weblint [BOWE96], an analogue to the standard UNIX
lint utility, written in Perl. We modified weblint
to report the classes of errors in a document rather than a
line-by-line analysis.
Results
We examined over 2.6 million HTML documents collected by the Inktomi
crawler in November of 1995. Although Inktomi occasionally downloads
non-HTML documents, the results presented reflect only HTML documents.
(For example, we filtered out all binary files, such as images.)
Furthermore, because Inktomi implements the Robot
Exclusion Standard, the contents of automated databases
which follow the standard
(e.g., genome data sets) have also been excluded.
The distribution of the documents in the data set by domain
appears in Table 1.
Table 1: Documents Studied by Domain
| Domain | # of HTML Documents
| % of Total
|
|---|
| other | 1064318
| 41%
|
| com | 516709
| 20%
|
| edu | 698616
| 27%
|
| gov | 117125
| 4%
|
| net | 113595
| 4%
|
| mil | 14734
| 1%
|
| org | 89939
| 3%
|
| total | 2615036
| 100%
|
|---|
Here, ``other'' includes all domains other than the given top-level
domains. For example, ``other'' contains all non-US top-level domains
(such as Germany's .de).
We analyzed a variety of properties of these documents.
In this paper, we present results on the following:
Document Size
After all markup had been extracted, the size of each HTML document
was measured. For the entire data set, the mean size was 4.4KB, the
median size was 2.0KB, and the maximum size was 1.6MB.
Figure 1 presents different views of the size distribution. On
first inspection, this distribution appears to be exponential (the
magenta line represents the location of the mean). However, further
zooming indicates a curve before the distribution begins to taper off.
The final graph in Figure 1
contains a semilog plot of the same data (in which the
sizes are plotted logarithmically and the number of documents is
plotted arithmetically).
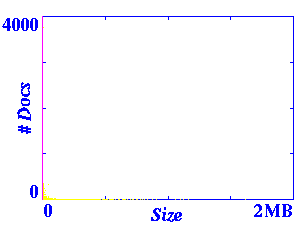
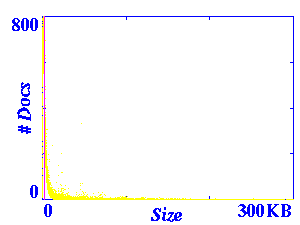
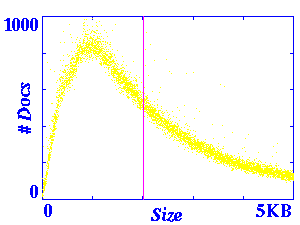
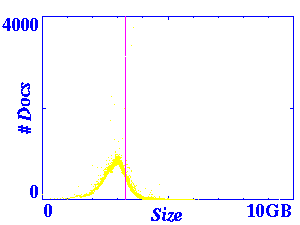
Figure 1: Size Distribution
These simple size distribution plots proved to be very useful in
detecting several problems with the data set. Many of the outliers
were caused by one of two major classes of errors:
- Problematic URLs: when faced with incorrect URLs that
contain valid prefixes, some HTTP servers return the file matching the
valid prefix. For example, the data set contains hundreds of
documents with URLs of the form
http://bazaar.com/underground2.html/..., all of which are
identical to http://bazaar.com/underground2.html. There
does not appear to be a general way for a client program (such as a
crawler) to differentiate this situation from a site containing a
large number of identical files.
- CGI Error Responses: some of the most popular CGI programs,
such as NCSA imagemap and CERN HTImage, report
errors with messages containing HTTP status ``200'' (success).
Because the image map programs all happen to return fixed error
messages, we were able to detect and eliminate those particular
messages, but there (again) does not appear to be any general way for
a client to distinguish ``200'' error messages from valid documents.
Tag/Size Ratio
For each document
we examined the ratio of the total number of tags
to its size.
Figure 2 contains the results.
An interesting pattern emerges - rays radiating out from the
origin, indicating a number of documents with constant tag/size
ratios. One such ray is indicated by the green ellipse.
We examined a number of these rays and determined that
they represented different versions of the same document
(occurring in archives or mirrored sites). This suggests that
the tag/size ratio might be used as a component of a signature
for an HTML document, e.g., for purposes of copy detection.
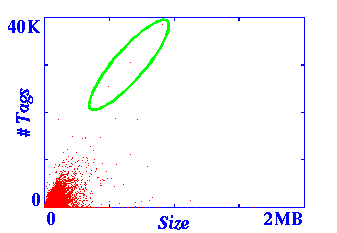
Figure 2: Tag/Size Ratio
Tag Usage
We examined the
distribution of tags.
We obtained a list
of valid tags from the Sandia HTML Reference Manual
[HANN95].
The average number of total tags per document was 71.
The average number of unique tags per document was 11.
We examined the most popular tags. The top graph of Figure 3
shows the top
ten tags (ranked according to the number of documents in which the
tag appeared at least once). The bottom graph indicates the average
number of occurrences of the tag per document.
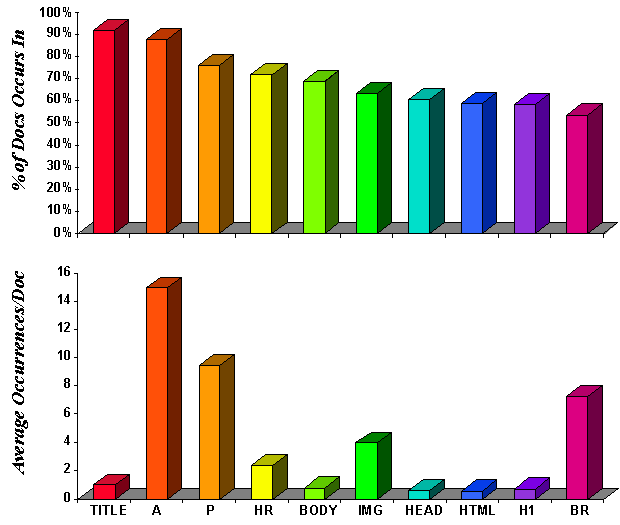
Figure 3: Ten Most-Used Tags
We also examined the least popular tags. Several tags,
BDO,
COLGROUP,
and
NOEMBED
were used zero times
in our data set of over 2.6 million HTML documents.
A number of other tags appeared a very limited number of times.
Attribute Usage
We examined the
distribution of attributes.
The average number
of total attributes per document was 29. The average number of unique
attributes per document was 4.
We examined the most popular attributes. Figure 4 shows the top
ten attributes (ranked according to the number of documents
in which the attribute appeared at least once). HREF appeared
an average of 14 times per document.
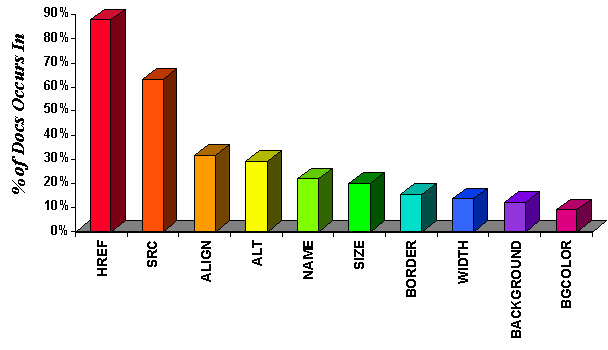
Figure 4: Ten Most-Used Attributes
We also examined the least popular attributes. Several attributes,
ACCEPT-CHARSET,
AXIS,
CHAROFF,
and
CONTROLS,
were used zero times
in our data set of 2.6 million HTML documents.
A number of other attributes appeared a very limited number of times.
Browser-specific Extension Usage
We also studied the use of browser-specific extensions. These consist
of HTML features (i.e., tags or attributes) added by vendors rather
than by the standards process. Here, we contrast the use of such
extensions in the first Inktomi data set (1.3 million documents,
collected in mid-1995) and the second Inktomi data set (2.6 million
documents, collected in November 1995).
Figure 5 shows the percentage of documents in which the four
most popular extensions are used. The usage of most of these features
has risen dramatically, indicating wide user acceptance. Other
features, such as BLINK,
have not experienced such growth.
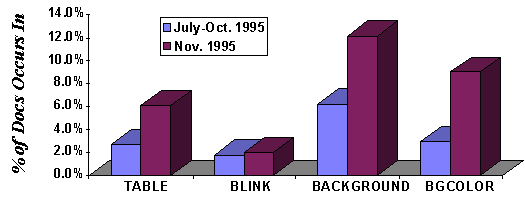
Figure 5: Browser-Specific Extensions Usage
Figure 6 indicates the popularity of various proposals for
dynamic addition of functionality to browsers. APP
and APPLET
support SunSoft's Java ``applet'' language, DYNSRC
supports VRML markup, and EMBED
supports Netscape's third-party ``plug-in'' modules. All have enjoyed
significant growth, though the oldest and most popular method (Java,
first released in May 1995 [KARP95]) still has
very low usage.
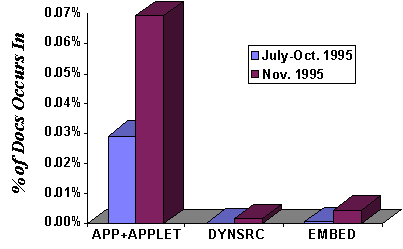
Figure 6: Browser-Specific Extensions Usage
Port Usage
For each of the HTML documents in our data set, we extracted
the port number used to access the document. We analyzed the
distribution of port numbers. While 418 unique ports
were observed, six ports accounted for over 98% of the
documents. Table 2 presents the most popular ports.
Table 2: Port Usage
| Category
| Port
| % of Docs
|
| Standard
| 80
| 93.6%
|
| < 1024
| 70
| 0.3%
|
| >= 1024
| 8000
| 0.5%
|
| 8001
| 0.5%
|
| 8080
| 0.7%
|
| 8888
| 2.8%
|
Port 80, the standard HTTP port,
was used for approximately 94% of the documents. Port 70
(the standard Gopher port) was used for approximately
0.3% of the documents (this number is slightly lower than
the 1% usage of port 70 observed in our earlier data set).
We checked many of the documents being
served from port 70; all the ones we examined were in fact
HTML documents. Ports 8000, 8001, and 8080, and 8888
accounted for the majority of the remaining documents.
The strong preference for ``8'' and ``80'' in the non-standard
ports is presumably related to the standard port number ``80''
Protocols Used in Child URLs
As discussed above, we extracted child URLs from all HTML documents
in our data set.
Figure 7 presents the distribution of protocols in
this set of child URLs.
By far, the most dominant protocol observed was HTTP
(there were an average of 17 HTTP URLs per document).
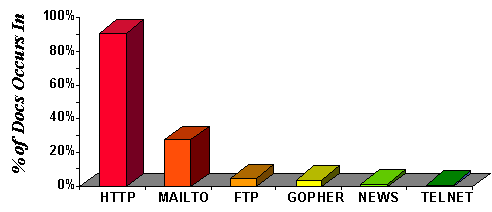
Figure 7: Protocol Usage
File Types Used in Child URLs
We also studied the distribution of file types described in the set of
extracted child URLs. We inferred the file type from the file name
extensions (e.g., ``.gif'') found in the URL path. In Table 3,
the ``% of Docs'' column indicates the percentage of
documents which contained a file of a given type.
The ``# of
Occurrences'' column shows the total number of extensions of the given
file type that were observed.
The ``# of
Docs'' column indicates the number of documents which contained
one or more extensions of the indicated type.
Note that files can be counted multiple
times, e.g., file.ps.Z would be counted as a file having both
``.ps'' and ``.Z'' extensions.
Table 3: File Type and File Name Extensions
| Category
| Type (Extension)
| % of Docs
| # of Occurrences
| # of Docs
|
| Compression/Archive
| GNU zip (gz/gzip/taz/tgz)
| 0.7%
| 126839
| 18694
|
| Zip (zip)
| 0.7%
| 157918
| 17277
|
| compress (Z)
| 0.6%
| 121519
| 16857
|
| BinHex (hqx)
| 0.3%
| 138259
| 7188
|
| StuffIt (sea)
| 0.1%
| 5290
| 2615
|
| LHArc (lha/lharc)
| 0.0%
| 20985
| 597
|
| ARC archive (arc)
| 0.0%
| 432
| 129
|
| Document
| HTML (htm/html)
| 76.3%
| 21982792
| 1995731
|
| text (txt)
| 2.2%
| 325165
| 57476
|
| PostScript (eps/ps)
| 1.8%
| 239949
| 46977
|
| MS Word (doc)
| 0.2%
| 20153
| 5959
|
| Adobe Acrobat (pdf)
| 0.2%
| 30640
| 5360
|
| TeX DVI (dvi)
| 0.2%
| 14680
| 4163
|
| Tex (tex)
| 0.1%
| 11998
| 2993
|
| TROFF (man/me/ms)
| 0.1%
| 6488
| 2191
|
| Rich Text (rtf)
| 0.0%
| 3921
| 1184
|
| Maker Interchange (mif)
| 0.0%
| 262
| 113
|
| Audio
| Sun audio (au)
| 0.7%
| 60405
| 18865
|
| MS WAVE (wav)
| 0.3%
| 24361
| 7325
|
| Audio IFF (aif/aifc/aiff)
| 0.1%
| 7761
| 2611
|
| MIME audio (snd)
| 0.0%
| 1839
| 600
|
| Amiga MOD (mod/nst)
| 0.0%
| 4202
| 254
|
| IRCOM (sf)
| 0.0%
| 353
| 161
|
| IFF (iff)
| 0.0%
| 322
| 47
|
| SoundBlaster (voc)
| 0.0%
| 122
| 27
|
| U-law (ul)
| 0.0%
| 21
| 19
|
| FSSD (fssd/hcom)
| 0.0%
| 3
| 3
|
| Image
| GIF (gif)
| 61.7%
| 9990239
| 1614244
|
| JPEG (jpe/jpeg/jpg)
| 7.8%
| 811353
| 205088
|
| X bitmap (xbm)
| 2.9%
| 968410
| 75825
|
| TIFF (tif/tiff)
| 0.2%
| 22546
| 5416
|
| X pixmap (xpm)
| 0.0%
| 3448
| 814
|
| RGB (rgb)
| 0.0%
| 985
| 259
|
| portable pixmap (ppm)
| 0.0%
| 646
| 124
|
| portable graymap (pgm)
| 0.0%
| 219
| 78
|
| portable bitmap (pbm)
| 0.0%
| 114
| 70
|
| X window dump (xwd)
| 0.0%
| 277
| 66
|
| raster (ras)
| 0.0%
| 221
| 54
|
| portable anymap (pnm)
| 0.0%
| 51
| 7
|
| Movie
| MPEG (mpe/mpeg/mpg)
| 0.3%
| 21496
| 7460
|
| QuickTime (mov/qt)
| 0.2%
| 15026
| 5199
|
| MS video (avi)
| 0.1%
| 5589
| 1742
|
| SGI (movie)
| 0.0%
| 538
| 313
|
Number of In-links
We sorted the child URLs which we extracted according to the number of
times they occurred in our data set. This showed us the most
``popular'' sites, as measured by the number of in-links observed.
These appear in Table 4.
The in-link entries marked with (*) indicate sites that are
highly self-referential. That is, these sites (by inspection) appear
to contain a great number of links to their own top-level pages. It
would probably be instructive to count only links from outside a
given site.
Readability
The UNIX utility style was used to assess the readability
level of a subset of the HTML documents in our data set (approximately
150,000).
We remove HTML markup before invoking style on each document.
We do this for two reasons. First, style does not understand
HTML, so the extra punctuation would confuse its analyzer. Second,
breaking English text into sentences and sentence fragments can be
tricky and we need to provide the style analyzer with some
assistance. For example, it is not always clear when a bulleted list
should be ignored, treated as a single long sentence, or treated as a
list of individual sentences. When invoked on troff
documents, style uses a set of heuristics to insert
punctuation into text, using the markup to assist it [CHER81]. This
information is then used by later passes of the analyzer to determine
sentence and sentence fragment breaks. We use a similar set of
heuristics to insert periods and commas into HTML documents as we
strip out markup.
The numbers presented in Table 5 represent the scores of the
different domains on the Kincaid readability test.
Higher numbers represent more grammatical and lexical complexity.
Lower numbers represent more simple structure and word choice.
Documents with lower numbers are considered to be more
``readable''.
The ``other'' domain is excluded because it represents
extraordinarily diverse sources.
Table 5: Average Readability broken down by Domain
| Domain
| Readability Score
|
| com
| 10.3
|
| edu
| 11.0
|
| gov
| 10.0
|
| net
| 12.3
|
| mil
| 12.1
|
| org
| 11.2
|
Syntax Errors
weblint was used to assess the syntactic correctness of
a subset of the HTML documents in our data set
(approximately 92,000).
Figure 6 presents the top ten syntax errors ranked according
to the percentage of documents in which they appear.
(Note that ``netscape-attribute'' is not necessarily an
error, but rather indicates the percentage of documents
using Netscape-specific extensions.)
Observe that over 40% of the documents
in our study contain at least one error.
Descriptions of the errors appear in Table 6.
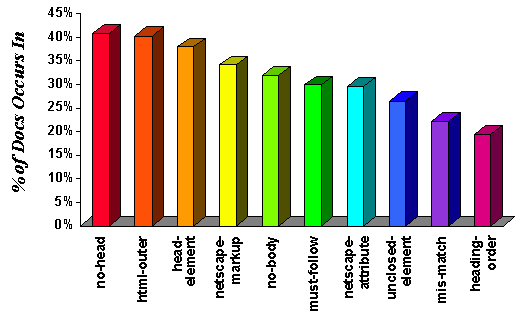
Figure 6: Ten Most Common Syntax Errors
| Error Name
| Explanation
|
| html-outer
| outer tags should be <HTML> .. </HTML>
|
| no-head
| missing <HEAD>
|
| head-element
| heading-only tag (TITLE, NEXTID, LINK, BASE, META) found outside
of heading
|
| no-body
| missing <BODY>
|
| must-follow
| required tag does not immediately follow another
|
| unclosed-element
| unclosed elements (e.g., <H1> ... )
|
| netscape-markup
| Netscape-specific tag
|
| empty-container
| empty container element
|
| mis-match
| mis-matched tag (e.g., <H1> ... </H2>)
|
| heading-order
| order of headings (e.g., <H3> following <H1>)
|
Table 6: List of weblint Errors
Conclusions
We have reported the results of our examination of pages from the
World Wide Web. Additional data not presented in the hardcopy
version of this paper may be found at
http://www.cs.berkeley.edu/~woodruff/inktomi/
.
Truisms
There are two maxims which are particularly apropos of our
experience. First, dealing with large data sets is difficult
and time-consuming. None of the existing tools which
we used scaled adequately to dealing with a data set on the
order of millions of documents.
Second, we observed empirically that the Web changes
exceptionally quickly.
Many properties of the documents in our first data set have altered
in the months since the data was collected.
The largest document in our data set was 1.6Mbytes; we checked the
current size of that same document. It has grown to 9Mbytes.
As another example, many of the most popular URLs in the
first data set no longer exist.
Future Directions
A longitudinal study examining trends would be extremely interesting.
Our limited observation reveals that while certain charactertistics
change fairly quickly (e.g., new features are introduced) others
appear to change more slowly (e.g., average document size and reading level
did not appear to change between the time periods we observed).
One could also consider how the introduction of new tools impact
these characteristics.
For example, as authoring tools become more common, one could study
their impact on the number and type of syntax errors.
Structural graph analysis has many applications in this area.
In particular, analysis
of the kind practiced by sociologists in structural network
analysis [WASS94] promises insight.
However, existing social network algorithms are several orders
of magnitude more complex than is viable for a data set of this
size. Significant work would have to be done to make such
analysis feasible.
It would also be interesting to allow user-defined queries against
the data set. The simplest functionality would be to allow a
user to ascertain how a form-specified URL compared with the data
set. A more interesting and complex interface would allow the user
to define arbitrary queries on the data set.
REFERENCES
- [BOWE96]
- N. Bowers, ``Weblint Home Page (version 1.013),'' Khoral Research,
Inc., Albuquerque, NM, Jan. 1996. Available as
http://www.khoral.com/staff/neilb/weblint.html.
- [CATL95]
- L. D. Catledge and J. E. Pitkow, ``Characterizing Browsing
Strategies in the World-Wide Web,'' Proc. 3rd Int. World Wide Web
Conf., Darmstadt, Germany, Apr. 1995. Available as
http://www.igd.fhg.de/www/www95/proceedings/papers/80/userpatterns/UserPatterns.Paper4.formatted.html.
- [CHER81]
- L. L. Cherry, ``Writing Tools - The STYLE and DICTION Programs,''
Computer Science Technical Report No. 91 (TM 79-1271-13), Bell
Laboratories, Murray Hill, NJ, Feb. 1981. Revised version reprinted
as L. L. Cherry and W. Vesterman, ``Writing Tools - The STYLE and
DICTION Programs,'' 4.4 BSD User's Supplementary Documents, Computer
Science Research Group, Berkeley, CA, 1994.
- [CHI95]
- E. H. Chi, ``Webspace Visualization,'' The Geometry Center,
Univ. of Minnesota, Minneapolis, MN. Available as
http://www.geom.umn.edu/docs/weboogl/webspace/webspace.html.
- [COMM95]
- CommerceNet Consortium, ``The CommerceNet/Nielsen Internet
Demographics Survey,'' Menlo Park, CA, 1995. Available as
http://www.commerce.net/information/surveys/execsum/exec_sum.html.
- [CONN95]
- D. Connolly, ``A Lexical Analyzer for HTML and Basic SGML,'' W3C
Working Draft, World Wide Web Consortium, Cambridge, MA, Dec. 1995.
Available as
http://www.w3.org/pub/WWW/TR/.
- [FIEL95]
- R. Fielding,
``Relative Uniform Resource Locators,''
RFC 1808, June 1995. Available as
http://www.cis.ohio-state.edu/htbin/rfc/rfc1808.
- [FRYS94]
- H. Frystyk and H. W. Lie, ``Towards a Uniform Library of Common
Code: A Presentation of the World Wide Web Library,'' Proc. 2nd
Int. World Wide Web Conference, Chicago, IL, Oct. 1994. Available
as
http://www.ncsa.uiuc.edu/SDG/IT94/Proceedings/DDay/frystyk/LibraryPaper.html.
- [HANN95]
- M. J. Hannah, ``HTML Reference Manual,'' Sandia National
Laboratories, Albuquerque, NM, Dec. 1995. Available as
http://www.sandia.gov/sci_compute/html_ref.html.
- [KARP95]
- R. Karpinski, ``Hot Java Arrives: Sun Aims to Revolutionize the
Web,'' InteractiveAge, May 22, 1995. Available as
http://techweb.cmp.com/ia/15issue/15hotjava.html
- [LYCO95]
- Lycos, Inc., ``The Lycos 250 and Hot Lists,'' Pittsburgh, PA,
Sep. 1995. Available as
http://www.lycos.com/lists/index.html.
- [MAUL94]
- M. L. Mauldin and J. R. R. Leavitt,
``Web Agent Related Research at the Center for Machine
Translation,'' 1994 Meeting of the ACM Special Interest Group on
Networked Information Discovery and Retrieval, McLean, VA, Aug. 1994.
Available as http://fuzine.mt.cs.cmu.edu/mlm/signidr94.html,
Carnegie Mellon Univ., Jul. 1994.
- [MUKH95]
- S. Mukherjea and J. D. Foley, ``Visualizing the World-Wide Web
with the Navigational View Builder,'' Proc. 3rd Int. World Wide Web
Conf., Darmstadt, Germany, Apr. 1995. Available as
http://www.igd.fhg.de/www/www95/proceedings/papers/44/mukh/mukh.html.
- [PIRO95]
- P. Pirolli, J. Pitkow and R. Rao, ``Silk from a Sow's Ear:
Extracting Usable Structures from the Web,'' Xerox PARC, Palo Alto,
CA, Nov. 1995. Submitted for publication.
- [PITK94a]
- J. E. Pitkow and K. Bharat, ``WEBVIZ: A Tool for World Wide Web
Access Log Visualization,'' Proc. 1st Int. World Wide Web
Conf., Geneva, Switzerland, May 1994. Available as
http://www1.cern.ch/WWW94/PrelimProcs.html.
- [PITK94b]
- J. E. Pitkow and M. M. Recker, ``Results From The First World-Wide
Web User Survey'', Georgia Institute of Technology, Atlanta, GA,
Jan. 1994. Available as
http://www.gatech.edu/pitkow/survey/survey-1-1994/survey-paper.html.
- [PITK95a]
- J. E. Pitkow and M. M. Recker, ``Using the Web as a Survey Tool:
Results from the Second WWW User Survey,'' Proc. 3rd Int. World
Wide Web Conf., Darmstadt, Germany, Apr. 1995. Available as
http://www.igd.fhg.de/www/www95/proceedings/papers/79/survey/survey_2_paper.html.
- [PITK95b]
- J. E. Pitkow and C. Kehoe, ``The GVU Center's 3rd WWW User
Survey,'' Georgia Institute of Technology, Atlanta, GA, Apr. 1995.
Available as
http://www.cc.gatech.edu/gvu/user_surveys/survey-04-1995/.
- [RISS95]
- M. Rissa and C. Oy, ``WWW User Survey Results,'' Helsinki,
Finland, Feb. 1995. Available as
http://www.mroy.fi/dec94.htm.
- [WASS94]
- S. Wasserman and K. Faust, ``Social Network Analysis: Methods and
Applications,'' Cambridge University Press, Cambridge, UK, 1994.
- [YAHO95]
- Yahoo, Inc., ``Survey Says...'' Mountain View, CA, Aug. 1995.
Available as
http://www.yahoo.com/docs/survey/first.html
and
http://www.yahoo.com/docs/survey/index.html.
 Fifth International World Wide Web Conference
 Fifth International World Wide Web Conference


