The aim of web clustering is to group web documents into very
identifiable classes in such a way that common web activities can
be improved. However, due to the huge quantity of web documents,
techniques focused on web clustering must be efficient enough to
manipulate even millions of elements. Because of that, linear
models are generally preferred. One such linear model is the
k-means algorithm [4], which can iteratively
cluster a document collection into ![]() classes.
classes.
The traditional k-means algorithm uses the vector model
[2] for representing
documents. In this model, given a web document collection
![]() with
with ![]() documents, every element
documents, every element
![]() is
represented by a vector
is
represented by a vector ![]() in a
in a ![]() -dimensional space,
typically
-dimensional space,
typically ![]() . Each
dimension stands for the frequency of term
. Each
dimension stands for the frequency of term ![]() in the document
in the document
![]() , where
, where ![]() . A dictionary
with the
. A dictionary
with the ![]() terms
terms
![]() can be
build with the
can be
build with the ![]() more frequent terms
in the collection
more frequent terms
in the collection ![]() [6], for
example.
[6], for
example.
The k-means algorithm works by finding ![]() centers of gravity
centers of gravity
![]() , each of
which will attract some elements and form a cluster. The center
, each of
which will attract some elements and form a cluster. The center
![]() represents cluster
represents cluster
![]() . Initially, these
. Initially, these
![]() centers are randomly
selected. Then, iteratively the elements of
centers are randomly
selected. Then, iteratively the elements of ![]() will be assigned
to some cluster. In each phase every element is associated with
the nearest center according to some
will be assigned
to some cluster. In each phase every element is associated with
the nearest center according to some ![]() measure
measure ![]() . After that, centers are recalculated to minimize
the criteria:
. After that, centers are recalculated to minimize
the criteria:
There are many distance measures in the literature [7], but Jaccard Extended Distance has showed good clustering performance [6]. This function was used in this work.
This poster presents a variant for the representation of web documents using symbolic objects. The details of some experiments are first showed. Conclusions and future work are left for the final part.
Symbolic objects are vectors where each entry can have any type: scalar, set, interval, histogram, graph, you name it. In the particular case of this poster, the histogram representation was explored.
Each document is represented with a symbolic object with four
histogram entries. These four variables correspond to frequency
of terms in four sections of the HTML code: text, bold, links and
title. Each symbolic object is built after the web collection is
analyzed and the most frequent terms are obtained. Previously,
![]() are eliminated and
Porter's stemming algorithm is applied to every word in any of
those four sections.
are eliminated and
Porter's stemming algorithm is applied to every word in any of
those four sections.
More formally, each document ![]() in the collection
in the collection ![]() is represented by the symbolic object
is represented by the symbolic object
![]() in
in ![]() histogram dimensions
histogram dimensions
![]() . Each variable
. Each variable ![]() is a normalized
histogram
is a normalized
histogram
![]() with
with ![]()
![]() or
or ![]() .
.
The distance measure used is based on the affinity
index [1] and uses
weights ![]() for every
dimension:
for every
dimension:
|
|
We used a subset of the web collection from [3] for testing our approach. This series contains 684 documents from 4 classes. The evaluation of the resulting clusters was made using the rand index and the mutual information measures [7]. The former computes how similar is the clustering obtained to the manual clustering (also present in the web collection). The latter calculates the quality of the clusters according to how compact the cluster is. Experiments were repeated 50 times each over database.
The results for web collection clustering are presented in
Table 1. The vectorial representation
of this series is formed by a 684 x 200 matrix. On the other
hand, each symbolic model is accompanied by the number of
categories in the histogram, i.e. ![]() . Every symbolic representation appears to be slightly
better than the vector representation in both indexes. Using 30
categories is a good balance between accuracy and efficiency.
Adding more categories to the histograms doesn't improve much
more the clustering.
. Every symbolic representation appears to be slightly
better than the vector representation in both indexes. Using 30
categories is a good balance between accuracy and efficiency.
Adding more categories to the histograms doesn't improve much
more the clustering.
It can be seen in table 1 the average time taken by the different approaches to cluster this series. The symbolic objects show how efficient such representation can be. Using 10 categories in histograms, symbolic objects are near 9 times faster than vector representation.
Table 2 shows the results for this
series using an approach called global k-means [5]. This clustering method is
completely deterministic and is based on the computation of good
initial clusters. This algorithm iteratively builds the
best clustering for web collection, using 1 cluster the
first time, 2 clusters the second time, until ![]() clusters are considered.
However, each time it passes throughout all individuals, making
global k-means computationally costly. In table 2 it can be appreciated that the best results
were obtained by the 30 categories histogram representation,
which is again three times faster than the vectorial model.
clusters are considered.
However, each time it passes throughout all individuals, making
global k-means computationally costly. In table 2 it can be appreciated that the best results
were obtained by the 30 categories histogram representation,
which is again three times faster than the vectorial model.
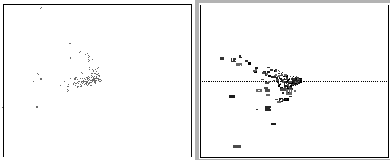
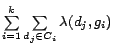
Figure 1 shows two PCA or principal component analysis [1] over this series. The PCA is a dimension reduction technique. The left graphic was made using the classic representation, while the right graphic was made with symbolic representation. The inertia percentage (how much information is conserved after the transformation) of the classic PCA was 28.89%, but using symbolic PCA the inertia percentage is 62.90%. The graphic on the right doesn't show points, as in the left, but rectangles that represent the variability of concepts.
Besides these results, we also used the quality measures from [8]. The quality of the partition can be decomposed for each variable, to measure the importance of each variable to form the clustering. In one run of this series, using a symbolic object of histograms with 30 categories, the quality indexes for the different variables were: text=0.0348, link=0.0211, bold=0.0215 and title=0.0573. Meaning this that the title in web documents helps a lot in building the clustering.
We are currently working on different distance measures between histograms and a variant of k-means algorithm to take into account what is called strong forms to better clustering a document collection.
In the future, we would like to extend the representation of the symbolic object used in this poster to include more information about the document.