1. INTRODUCTION
With large volume of digitized news information published on the Web, it becomes increasingly difficult and time consuming for human users to conceptualize a specific interesting news affair. Two existing approaches, searching and clustering, address this problem from different aspects. Searching retrieves a list of relevant news stories to the topic and clustering organizes discovered news stories into a flat hierarchical structure, either manually or automatically. Both approaches fail to present the inside structure of the evolutions of news events within the news affair. Some recent work [1, 2] made good attempts in modeling this type of evolution structures. In this work, we propose to use event evolution graph to model the evolutions of news events within a news affair.
2. EVENT EVOLUTION GRAPH
Users are often as interested in the development of news events as in their details when reading news stories from newswires (such as CNN or BBC). However, existing techniques mostly deals with the retrieving of relevant documents to a given topic and how to organize them into a hierarchical structure, as in Topic Detection and Tracking (TDT). Our approach not only identifies the news events from news stories but also models the developments or evolutions between these news events.
We define event evolution as the directional dependencies or relatedness, which exhibit the track of event development, between two events inside a same news affair. For two events A and B, if the event evolution from event A to B exists, we assert that there is an event evolution relationship between event A and B. For example, considering the following two events “Columbia space shuttle crashed” (A) and “NASA conducted investigations into the shuttle crash” (B), we can claim there is an event evolution relationship between event A and B.
Assume there are totally n events {ε1,
ε2, …,
εn} in a given news
affair. Each event εi
can be represented as <ti, Si>, where
ti is the timestamp of
εi and Si is the set of news stories
{di1, di2, ..., dim}
that belong to εi
(Si ≠
![]() ,
and
,
and
![]() Si,
Sj, Si ∩ Sj =
Si,
Sj, Si ∩ Sj =
![]() ).
ti can be further represented as a time interval
[si, ei];
when si = ei, the timestamp becomes a
spot time. We denote the event evolution relationship from event
εi
to event εj
as (εi,
εj) (i ≠
j).
).
ti can be further represented as a time interval
[si, ei];
when si = ei, the timestamp becomes a
spot time. We denote the event evolution relationship from event
εi
to event εj
as (εi,
εj) (i ≠
j).
Given the set of events and the event evolution relationships between them,
the best structure to present the blueprint of that news affair is a
directed graph. Literally, event evolution graph is defined as a
directed acyclic graph (DAG) G = (V, L) consisting of
events as the nodes V and event evolution relationships as the
directed edges L between nodes, where V = {ε1,
ε2, …,
εn} and L =
{(εi,
εj)} (εi,
εj
![]() V).
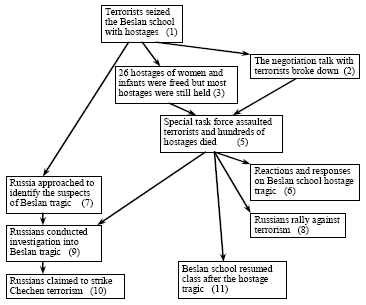
Figure 1 displays a part of the sample event evolution graph for the news
affair of Beslan school hostage tragedy that happened in Russia in 2004.
V).
Figure 1 displays a part of the sample event evolution graph for the news
affair of Beslan school hostage tragedy that happened in Russia in 2004.
Figure 1. The partial event evolution graph for “Beslan school hostage crisis”. The numbers in the bracket indicates their temporal orderings.
3. MINING EVENT EVOLUTION GRAPHS
Makkonen [1] first developed the ontologies, including general terms, locations, names, and temporals, to measure the relatedness of events. It was later found by Nallapati et al. [2] that location and name features as suggested by Makkonen [1] were not effective in modeling event evolutions. In our work we utilize the event content similarity to measure the confidence of event evolution relationships. In addition to that, we incorporated two decaying factors into the function, i.e. temporal proximity and document distributional proximity.
· Event Content Similarity
We measure the content similarity between events by the cosine similarity between their event term vectors. This coincides with our intuition: for two events between which there is an event evolution relationship, they often share similar key vocabularies in their news stories and reference one the other in their texts.
The event term vector of event εi is computed as the average of the document term vectors of stories that belong to εi. Note that here only term frequency is applied instead of the TF-IDF measure that is common in other information retrieval techniques.
The event content similarity between events εi and εj is:
![]() (1)
(1)
where etv(Si) and etv(Sj) are the event term vectors of εi and εj.
· Temporal Proximity
We first define the temporal distance between two events εi and εj as (assuming si ≤ sj):
![]() (2)
(2)
The temporal distance between events is also helpful in measuring the confidence of event evolution relationships. Intuitively if two events are far away from each other along the timeline, then the event evolution is less likely to exist between them than those events close to each other. We use the temporal proximity between events to measure the relative temporal distance between two events, i.e. (assuming si ≤ sj):
 (3)
(3)
where T is the event horizon defined as the time-span of the entire news affair. α is the time decaying weight which is between 0 and 1.
· Document Distributional Proximity
Temporal proximity fails to perform well in some cases, such as when there is a burst of events and stories, usually at the beginning stage of a news affair. Therefore, we utilize the distribution of documents in order to counterwork the shortcomings of temporal proximity. We define the document distributional proximity as a second decaying function:
![]() (4)
(4)
where m is the number of documents that belong to the events happening in-between event εi and εj. N is the total number of documents in the topic. β is a decaying factor.
Finally the confidence of event evolution relationships is:
 (5)
(5)
To construct the event evolution graph, we simply assume that there is a hypothesized event evolution relationship between every pair of events in the news affair. We then compute the confidence of these event evolution relationships and filter away further undesirable event evolution relationships according to the static thresholding model described below.
G = (V, L) (6)
where,
![]() (7)
(7)
4. EXPERIMENTS
We have tested our proposed model on a corpus of news stories extracted from the CNN Newswire. All stories are written in English. The corpus is generated by automatic crawling and searching with the support of filtering by human annotator. There are totally 10 topics and 782 news stories in the corpus. The average length of documents is 582 words.
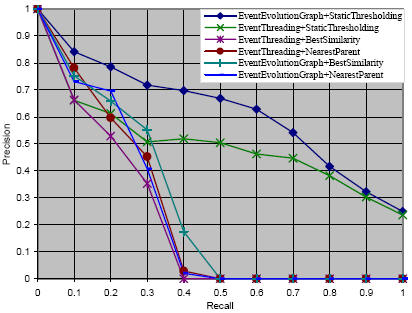
To avoid the errors generated by automatic clustering techniques and hence better compare the performances, we directly use the events manually clustered by human annotators as the test set. For the evaluation measures, we stick to the traditional measures of precision and recall and interpolate these rates to the standard 11 levels in the precision and recall graph.
Figure 2 shows the precision and recall curves of our experimental results. Our proposed model is the first approach (EventEvolutioniGraph+StaticThresholding) and the baseline is the third one (EventThreading+BestSimilarity) as claimed to perform best in Nallapati, et al. [2].

Figure 2. The Precision and Recall Curves (Interpolated to Standard 11 Levels) of the Comparative Experimental Results
5. CONCLUSIONS
In this paper, we have proposed the event evolution graph to model the evolution structure of news events inside a news affair in order to facilitate users’ information browsing tasks. We utilized the cosine similarity of event term vectors as well as two decaying factors, i.e. temporal proximity and document distributional proximity, to measure the relatedness of news events. Finally, we showed in the experimental evaluation that our model outperforms rival models and the baseline model substantially.
