In this paper we present the evolution of the structure of the Chilean Web between 2000 and 2002. Our results show that although the Web grows as expected, also a significant part of it disappears. In addition, some components are much more stable than others.
The Web is highly dynamic and little is known about its evolution. There are models that predict when a page will change, but that differs a lot from site to site. At a higher level, new websites appear and others disappear, but little is know how this happens. In this paper we present the evolution of the structure of the Chilean Web at the site and domain level, based on data gathered from a search engine targeted to this web domain, TodoCL.cl, between 2000 and 2002.
We define the Chilean Web as all the .cl sites plus all other sites found by crawling that have an IP belonging to a Chilean ISP. The first year the crawl started from an initial sample of sites, but subsequent years started from all .cl domains thanks to NIC Chile. Hence, the number of unconnected sites was low the first year. Also, the last crawl contains more dynamic pages, but this does not change the Web structure. Table 1 shows the sizes of the data used.
| Year | 2000 | 2001 | 2002 |
| Pages | 730.673 | 794.218 | 2.214.253 |
| Sites | 10.352 | 21.207 | 39.320 |
| Domains | 9.102 | 19.389 | 35.520 |
Our results present how the structure evolves, how sites migrate from one component to another component, and where sites appear and disappear. The changes are dramatic, corroborating that perhaps we are trying to study a process that is still in a transient phase, or that cannot be modeled in detail. This is a first step to measure and follow the evolution of part of the Web structure.
The most complete study of the Web structure [1] focus on page connectivity. One problem with this is that a page is not a logical unit (for example, a page can describe several documents and one document can be stored in several pages.) Hence, we decided to study the structure of how websites were connected, as websites are closer to be real logical units. Not surprisingly, we found in [2] that the structure in Chile at the website level was similar to the global Web, and hence we use the same notation of [1]. The components are:
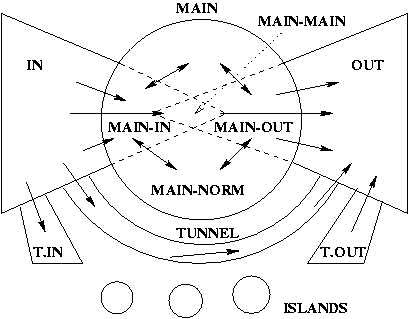
In [2] we analyzed the data for year 2000 and we extended this notation by dividing the MAIN component into four parts:
Figure 1 shows all these components.
 |
In Table 2 we give the relative size of each component. Notice the size of ISLANDS, which is near 50% of the Chilean Web sites. These sites are usually recent, and the main growth of the Web is in that component. The average update age of pages and sites, and their relation to structure and link ranking techniques is studied in [3] for the first two collections (2000 and 2001). We also considered domains in our study, although domains may contain sites that are quite different (for example, web hosting in an ISP provider using a common second-level domain).
| Component | Size (%) 2001 | Size (%) 2002 |
| MAIN | 9.25% | 11.98% |
| IN | 5.84% | 9.97% |
| OUT | 20.21% | 17.15% |
| TUNNEL | 0.22% | 0.23% |
| TENTACLE-IN | 3.04% | 3.11% |
| TENTACLE-OUT | 1.68% | 3.31% |
| ISLANDS | 59.76% | 54.25% |
| MAIN-MAIN | 3.45% | 4.09% |
| MAIN-OUT | 2.49% | 2.77% |
| MAIN-IN | 1.16% | 2.24% |
| MAIN-NORM | 2.15% | 2.88% |
Web sites evolve inside the structure. First, a typical Web site starts as part of ISLANDS or IN (depending if it links or not a good Web site). If the site becomes popular and they also link known sites, it migrates to MAIN. If links are not well chosen or updated, they go to OUT. Table 3 shows the number of sites and domains that have appeared and disappeared from year to year.
| Sites | Domains | ||||
| Year | 2000 | 2001 | 2002 | 2001 | 2002 |
| TOTAL | 7.497 | 21.207 | 39.320 | 19.389 | 35.520 |
| NEW | - | 15.415 | 23.937 | - | 21.397 |
| GONE | - | 1.705 | 5.824 | - | 5.266 |
In tables 4 and 5 we show the migration of sites among the components and domains, respectively. There are two ways of reading these tables. By columns we have from which component comes the sites/domains in each component. By rows, we see where are today the sites/domains of the components in the previous year. The last column and row represent the sites/domains that that do not longer exist (GONE) and the new sites/domains (NEW), respectively.
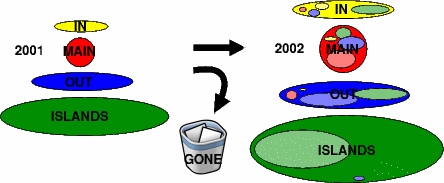
Notice that OUT and MAIN are stable components, because about 25% of the sites stay there. Is also interesting that MAIN grows from OUT by 20%, and that ISLANDS is the component with largest growth, but also death (see Table 5), followed by OUT.
| 2000\2001 | MAIN | OUT | IN | ISLANDS | TUNNEL | TIN | TOUT | GONE |
| MAIN | 959 | 724 | 140 | 305 | 11 | 61 | 24 | 509 |
| OUT | 195 | 1151 | 39 | 749 | 5 | 96 | 48 | 668 |
| IN | 39 | 89 | 118 | 279 | 2 | 31 | 25 | 226 |
| ISLANDS | 18 | 124 | 14 | 213 | 0 | 14 | 19 | 174 |
| TUNNEL | 1 | 1 | 3 | 18 | 0 | 0 | 2 | 3 |
| TIN | 5 | 31 | 0 | 18 | 3 | 3 | 2 | 37 |
| TOUT | 3 | 38 | 25 | 131 | 0 | 4 | 12 | 88 |
| NEW | 742 | 2128 | 901 | 10955 | 27 | 437 | 225 | - |
| 2001\2002 | MAIN | OUT | IN | ISLANDS | TUNNEL | TIN | TOUT | GONE |
| MAIN | 1214 | 339 | 158 | 42 | 1 | 17 | 8 | 183 |
| OUT | 901 | 1683 | 188 | 532 | 15 | 128 | 43 | 796 |
| IN | 233 | 98 | 292 | 196 | 1 | 22 | 16 | 382 |
| ISLANDS | 422 | 1351 | 786 | 5182 | 23 | 365 | 299 | 4240 |
| TUNNEL | 11 | 15 | 3 | 4 | 1 | 2 | 0 | 12 |
| TIN | 78 | 215 | 25 | 128 | 2 | 66 | 5 | 127 |
| TOUT | 52 | 79 | 41 | 59 | 0 | 18 | 24 | 84 |
| NEW | 1801 | 2965 | 2430 | 15173 | 50 | 608 | 910 | - |
| 2001\2002 | MAIN | OUT | IN | ISLANDS | TUNNEL | TIN | TOUT | GONE |
| MAIN | 918 | 218 | 79 | 35 | 0 | 4 | 4 | 141 |
| OUT | 892 | 1424 | 167 | 466 | 14 | 97 | 35 | 560 |
| IN | 206 | 79 | 288 | 182 | 2 | 19 | 9 | 326 |
| ISLANDS | 487 | 1276 | 970 | 4967 | 25 | 320 | 242 | 4074 |
| TUNNEL | 4 | 1 | 3 | 1 | 0 | 0 | 0 | 4 |
| TIN | 88 | 226 | 22 | 134 | 0 | 59 | 8 | 102 |
| TOUT | 35 | 22 | 39 | 35 | 0 | 2 | 19 | 59 |
| NEW | 1376 | 2176 | 2644 | 14171 | 27 | 419 | 584 | - |
Figures 2 and 3 show graphically the migration of sites and domains among the different components, using lighter colors to identify from where the sites came.
 |
 |
The overall number of sites of the Chilean Web is almost duplicating each year. However, that is the result of more than a 115% increase plus a 25% death. In addition, many sites, sometimes because of ignorance, do not allow crawlers to enter. For example, in 2001, 56% of the domains and 54% of the sites seem to had only one page. In fact, more than 25% of them had an initial Flash page or called a program.
We are currently studying the change at the level of pages related to the structure. For example, the largest 20 sites (in pages) in 2002 are all different from the largest sites in 2001. We are also analyzing the transitions over two years, to try to understand the time needed for the transitions.
We acknowledge the support of Millenium Nucleus Grant P01-029-F from Mideplan, Chile.