1. INTRODUCTION
With the advance of the Web and popularity of e-commerce, companies, organizations and individuals are increasingly using the Web to conduct businesses, and disseminate information on a global scale. A large amount of important and even sensitive information is now published on the Web by these companies, organizations and individuals. The amount of information is still growing at a phenomenal rate. With all this information publicly available, it offers a great opportunity for companies, organizations and individuals to get to know and to learn from each other, and to find useful/interesting information from each other's Web pages. This is not only important for individuals, but also important for businesses. In a business environment, knowing one's competitors is of crucial importance to the survival and growth of any business. Business intelligence information used to be very hard to find before the Web was available and before e-commerce became popular. Now, much of the information is accessible from the Web. However, this does not mean it is easy to obtain useful information from the competitors' Web sites. In fact, it is still a difficult and time-consuming task. In our interactions with industrial executives, we found that they often spent a large amount of time browsing through their competitors' Web sites in order to find what their competitors are doing so that they can learn from their competitors and to design effective measures to improve their competitiveness. Manual browsing is still the dominating technique. However, manual browsing is a hard and very time-consuming task because of the following main reasons:- A commercial site often has a large number of pages (hundreds, thousands or more), which makes it very difficult for manual browsing without any automated assistance. Even for a relatively small Web site, the number of Web pages could overwhelm the human user, not to mention that the number of pages in a typical site is still growing at an alarming rate.
- People often use anchor texts of hyperlinks to help them focus and decide whether to go to lower level pages to obtain further details. However, anchor texts can be quite ambiguous and misleading. This situation becomes worse if one browses through the Web site of a competitor from a different country due to culture differences.
- Different companies may organize the same information very differently. One company may use one page and another may use a few pages. Some even put different aspects of the same information in different categories. This makes it hard to obtain the complete information about a particular item.
- Similar pages: These pages in the competitor site are quite similar to some pages at the user site. Such pages allow the user to know how the competitor presents the same information and/or conduct the same business, from which the user can learn from his/her competitor and exploit any weakness of the competitor. If such pages can be highlighted to the user, he/she can quickly focus his/her attention on them to perform detailed analysis, e.g., browsing the actual pages.
- Different pages: These pages exist at the competitor site, but not at the user site (or vice versa). Such pages are often very interesting, as companies always want to know what their competitors have or are doing that they do not have or are not doing.
- Crawl the pages from the competitor site (assume the pages of the user site are available).
- Combine the pages in U and the pages in
C, i.e., A = U
 C.
C. - Cluster all the pages in A using a hierarchical clustering algorithm (see Section 3.1). This results in a cluster tree at different levels of details. At the bottom of the tree, we have all the individual pages in A. As we move up the tree, we have clusters and each cluster (or node) covers more and more pages, i.e., the clusters become larger and larger (we also have fewer and fewer clusters).
- Visualize the clustering results (see Section 3.2). Since the clustering results are represented as a tree, this step visualizes the cluster tree. The pages from different sites are represented with different colors. Thus, one part of a cluster can be in one color and the other part in another color. This enables the user to clearly see similar and different pages from U and C. In addition, each cluster in the tree also contains a rich set of summary information about the cluster.
- We use clustering to compare Web sites to help the user find similar and different pages, which are what the user is often interested in [21].
- We combine the pages from both U and C sites into one single set A, and cluster them together. Coupled with color effects (see above), similar and different pages and/or clusters from U and C can be visualized very clearly. Specifically, after clustering, we can see three types of clusters (note that individual pages can be seen as the smallest clusters) from the visualization:
- Pure C clusters: These clusters contain only C pages, which tell us that the competitor has some useful information that the user site does not have. These pages are often very useful as we discussed above because they often represent unexpected or unknown information (e.g., products and/or services) from the competitor.
- Pure U clusters: These clusters contain only U pages, which show that the user site has some useful information that the competitor does not have. These pages are also useful as the user company can take advantage of this fact in marketing to differentiate them from their competitor.
- Mixed clusters: Each of these clusters contains pages from both C and U. These clusters show that both sites have some similar pages. Such clusters are also useful. They allow the user to carry out focused study to find the finer commonalities and differences of the two sites.
2. RELATED WORK
The related work encompasses a number of areas, namely, clustering, visualization, and information extraction and discovery. We discuss them in turn below. Web page clustering has been studied by many researchers. For example, [34] studies clustering of a large number of Web pages; [28] studies parallel clustering; [14] studies clustering of web users and [1] studies document clustering with user interactions. Clustering is often used to summarize a large number of pages to facilitate user focusing [34, 1, 10]. We have discussed the differences of our work with normal Web page clustering in the introduction section. We will not repeat them here. In the Web context, visualization has also been explored extensively. For example, [30, 7, 34] study visualization of search results; [6, 17, 15] study visualization of the user's web browsing experience and surfing history; [5] studies visualization of a page in a summarized form; [23] studies visualization of Web structures; [9, 13] study visualization and tracking of Web structure changes; and [11, 19] provide visual supports for web querying. Clearly, these works are different from ours as we visualize the comparison of Web sites. With regard to finding useful information from the Web, our technique is also different from existing approaches. Existing methods focus on what the user wants or specifies explicitly. These techniques include keyword-based search, wrapper-based information extraction, user preferences, Web and XML queries, and resource discovery. In keyword-based search, the user specifies some keywords, and a search engine (e.g., Yahoo!, Excite, Alta Vista, and Google) finds those Web pages that contain the keywords, and ranks them according to various measures [4, 12]. In Web information extraction [e.g., 2, 26], a wrapper or a specific extraction procedure is built automatically or manually for a Web page to extract some specific pieces of information requested by the user. User preference based approaches are commonly used in push type of systems [e.g., 33], where the user specifies what categories of information are interesting to him/her. The system then gives him/her only those types of information in the user-specified preference categories. In Web query based approaches, database query language SQL is extended and modified so that it can be used to query semi-structured information resources, such as XML documents and Web pages [e.g., 22, 19]. Web resource discovery finds Web pages related to the user's requests [e.g., 8, 12]. This approach uses techniques such as link analysis and text classification algorithms to find relevant pages. The pages can also be grouped into authoritative pages, and hubs. All these existing approaches essentially view the process of finding useful information from the Web as a query-based process, although the queries may be of different forms, search query, information extraction query, preference query, Web, XML or semi-structured data query, and resource query. These approaches suffer from a major shortcoming. They do not help the user find unexpected information, which is unknown to the user or contradicts the user's existing beliefs. They can only find anticipated information because user queries can only be derived from the user's existing knowledge space. Yet, a lot of information that does not meet the user's queries may also be of interest to the user. These pieces of information are often novel. Our approach is able to highlight unanticipated pages and clusters, e.g., pages that exist in C but not in U, which are often very useful. Our method is also able to help the user find what he/she wants, as we will see in subsequent sections. In [21], we reported a Web comparison system. The system uses information retrieval and data mining techniques to compare keywords in U pages and C pages to identify those potentially interesting pages. The current work is different from that in [21] in two main aspects: (1) the work in [21] does not have a visualization component. All the comparison results in [21] are listed on the screen, which are hard to comprehend. The user is not given much freedom to choose what he/she wishes to see. The system presented in this paper is much more flexible. Due to its intuitive visualization system, the user is able to view and to choose whatever interests him/her. The visualization only highlights those potentially interesting pages and clusters. (2) [21] does not use clustering. The returned result is often very large, which overwhelms the user. Clustering helps to summarize similar pages. The user can see big pictures first before focusing on interesting details. This is important when a large number of pages are involved. In fact, it is these shortcomings of the existing system in [21] that motivated this work. Our work is also related to the interestingness research in data mining [20, 27, 31, 25]. The issue of interestingness is stated as follows: Many data mining algorithms often produce too many patterns or rules, and most of the rules are of no interest to the user. Due to the large number of rules, it is very difficult, if not impossible, for the human user to analyze them in order to find those truly interesting ones for application use. Automated assistance is needed. Past research has proposed a number of techniques [20, 27, 31, 25] for the purpose. These approaches are, however, not suitable for the Web. The reason is that rules are structured and have clear syntax and semantics, while information on the Web is semi-structured. Different methods are thus needed to help the user to find interesting information from Web pages.3. THE PROPOSED TECHNIQUE
This section presents the proposed technique, which helps the user compare and browse two Web sites. Let U = {u1, u2, ..., uw} be the set of pages in the user's Web site, and C = {c1, c2, ..., cv} be the set of pages in the competitor's Web site (which are crawled from the competitor site). As mentioned in the introduction section, our technique first combines the pages in U and C, i.e., A = U3.1. Hierarchical Clustering
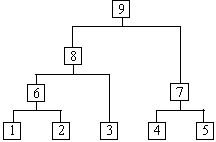
In our work, we use agglomerative hierarchical clustering, which produces a nested sequence of clusters [18, 32] like a tree structure (also called a dendrogram or a cluster tree). Singleton clusters (individual pages in our case) are at the bottom of the tree. One root cluster is at the top, which covers all the pages. The clustering process starts building the dendrogram from the bottom level, and merging the most similar (or nearest) cluster pairs at each level up until all the pages are merged into a single cluster (i.e., the root cluster). Figure 1 shows a schematic example. At the bottom of the tree, we have 5 clusters (5 Web pages). Cluster 6 is formed by merging clusters 1 and 2 (assume they are most similar to each other). Cluster 8 is formed by merging clusters 6 and 3, etc. As we move up the cluster tree, we have fewer and fewer clusters. Since the whole clustering tree can be stored in the clustering process, the user can choose to view clusters at any level of the tree.|
|
The reason that we choose this hierarchical clustering method is precisely because the cluster tree allows the user to view clusters at any level of details. It makes user analysis and visualization of the two Web sites very convenient. That is, the user can drill down and roll up to see clusters and pages at any level of granularity. This process is also facilitated by our visualization system, i.e., the users can "click, change, and see" the results at any level on the fly. In each cluster node, valuable pieces of summary information are also be stored in the clustering process, which will be very useful subsequently (as we will see later). If we used a clustering technique that requires a fixed number of clusters as input, e.g., k-means clustering [18, 32], we will not only have a problem in providing the initial number of clusters k, but also give the user no flexibility to see the clustering at different levels of granularity. Additionally, Web pages are usually organized hierarchically based on their contents. Using hierarchical clustering fits this naturally, which facilitates the discovery of interesting pages and information. In this work, we only use textual information in a Web page for clustering. Each Web page is thus treated as a text document. The document representation scheme that we employ is the widely used vector space model [3, 29]. This representation is commonly used in information retrieval. The assumption of the representation is that similarities, differences and the main contents of text documents can be represented by keywords (also called index terms) that appear in the documents. In our clustering, the similarity or distance measure, which decides how pages are clustered, is the popular cosine measure used in document clustering. The details about the cosine measure can be found in [3]. Note that before clustering, we also remove words in a stoplist [3]. The stoplist contains words that have too low content discrimination power, e.g., "a", "the" and "and". Removal of such words reduces the length of the text documents, and also makes the similarity comparison of documents more accurate. Word stemming [3, 29] is also applied to reduce the remaining words to their stems by suffix stripping. Domain Specific Stoplist: Apart from the general stoplist that contains those common words that are not representative of document contents, the proposed technique also allows the user to input a domain specific stoplist. This domain specific stoplist contains those words that are very common in the application domain, e.g., "airline" and "travel" in the travel domain, and also the company name of each site. These words tend to blur the cluster boundary. Our experiments show that when a domain specific stoplist is used, the resulting clusters are much more informative and accurate.
3.2. Visualization
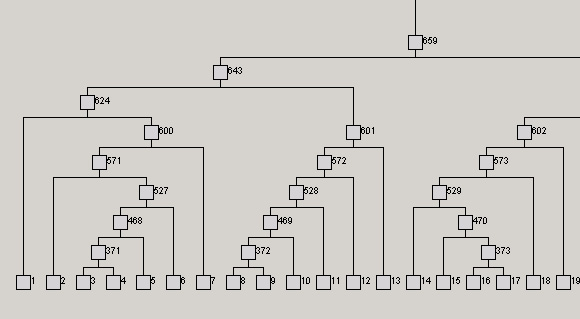
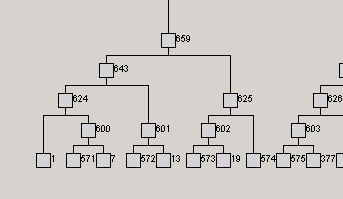
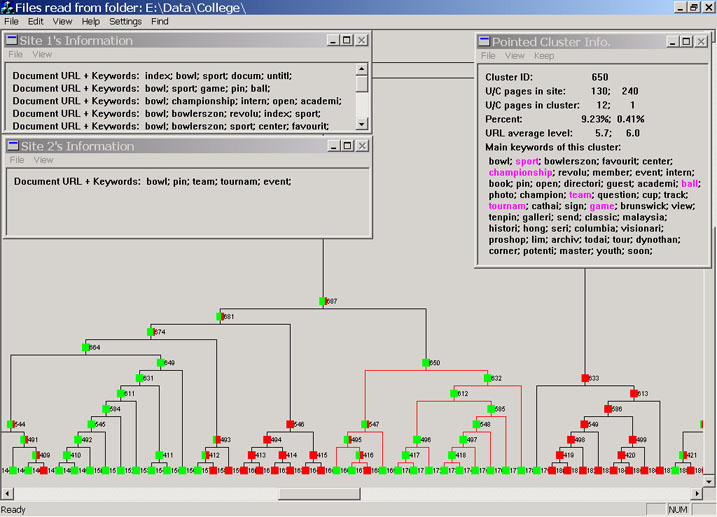
The visualization component of the proposed technique displays the cluster tree, which gives an intuitive view of the site comparison. It takes advantage of the superb visual capability of human users to enable them to spot interesting patterns, pages, and information easily. The tree structure naturally allows the user can drill down or roll up the cluster tree. Each node of the tree represents a cluster (at a particular level of granularity) and each link represents a parent-child relationship. Each parent cluster covers all the children clusters below, i.e., Web pages associated with a parent cluster include all the pages associated with its children clusters. Figure 2 shows an example tree (only part of a full tree). The number next to each cluster node represents the cluster ID, which facilitates the user to remember which cluster he/she is analyzing. From the visualization, the user can also easily see which clusters are closer to each other. For example, in Figure 2, we can clearly see that pages 3 and 4 are clustered together before they are clustered with page 5. We can also see that the first 7 pages are closer to one another than the pages from 8 to 13. By default, we display the whole tree on the screen. When the tree is too large, scroll bars can be used to see all the hidden clusters. Zoom-in and zoom-out mechanisms are also provided for the user to focus on a specific area or to see a global picture. Additionally, a "cut" operation may be performed to remove lower level clusters (for focusing). Figure 3 shows an example cut of Figure 2, where only the top 5 levels of clusters are displayed. A full screen dump from one of our real-life applications is shown in Figure 4. Each cluster is represented with a small rectangle. As the user moves the mouse to point to a cluster, summary information associated with the cluster is displayed in 3 separate windows (to be discussed below).|
Figure 2. Part of a dendrogram or cluster tree
Figure 3. Result of a cut of the top 5 levels
Figure 4. A full screen example |
- Different colors are used to represent pages in C and U sites. This enables the visualization system to reveal similarities and differences among the pages in U and C clearly. By default, we use green for U pages and red for C pages (the user can change these two colors).
- Each cluster (represented with a rectangle) is partitioned into two parts, which represent the proportions of pages from U and C covered by the cluster respectively. The two parts are also colored accordingly using green and red colors. For example, if a cluster covers 5 pages from the U site and 10 pages from the C site, then the rectangle will have 1/3 of the area colored in green, and 2/3 of the area colored in red.
- Each cluster is also associated with some summary information. When the user moves the mouse to point to a cluster, the summary information of the cluster will be shown in three small windows (see Figure 4). The first window lists the URLs of the pages from the U site (denoted as Site 1 on the screen), and optional top-ranking keywords of the pages. The second window lists the URLs of the pages from the C site (denoted as Site 2 on the screen) and the keywords from each C page. The user can click on any URL to open the page for browsing. Note that due to confidentiality reasons, we could not reveal our user site names. The site's URLs are masked with "Document URL" on the screen. The third window (on the right) gives a few other pieces of summary information:
- Cluster ID: This is the ID of the cluster that the user is currently focusing on. The user can use this ID number to find the cluster in the tree.
- U/C pages in site: These two numbers give the total number of pages in the U site and the total number of pages in the C site respectively.
- U/C pages in cluster: These two numbers give the number of U pages and the number of C pages in the cluster respectively.
- Percent: These two numbers give the percent of U pages and the percent of C in the cluster with respect to the total number of pages in U and the total number of pages in C respectively. The user can use these two numbers to see how much emphasis each site is putting on the particular cluster (or topic).
- URL average levels: These two numbers give the average depth of the U pages and the average depth of the C pages in the cluster. This allows the user to see how deep some pages are buried in each site.
- Main keywords of this cluster: This gives the main keywords of the cluster. In other words, these keywords characterize the cluster. With these keywords, the user will know what this cluster is about and decide whether it is interesting to focus on this cluster and drill down to obtain further details. The system can also compare this cluster with a previous cluster and highlight the common keywords (e.g., keywords in purple in Figure 4).
- Besides the three small windows, the system allows the user to keep the summary information window and add more. Sometimes, the user may want to study multiple clusters (especially in the same sub-tree) at the same time. He/she can use the "keep" menu option to keep the current cluster's summary information windows on the screen, and navigate to other clusters. Two examples are shown in Section 5.
- A "find" function is also provided to enable the user to find those clusters that contain a set of user-specified keywords. These clusters are then highlighted on the screen. This function can be used to quickly focus on those interesting clusters. Section 5 gives an example.
- Pure C clusters: Rectangles representing such clusters are colored completely in red. These clusters tell the user that the competitor has some pages that the user site does not have. These pages are often very interesting.
- Pure U clusters: Rectangles representing such clusters are colored completely in green. These clusters show that the user site has some pages that the competitor does not have.
- Mixed clusters: Rectangles representing such clusters are partly colored in red and partly colored in green. These clusters show that both sites have some similar pages.
4. SYSTEM ARCHITECTURE
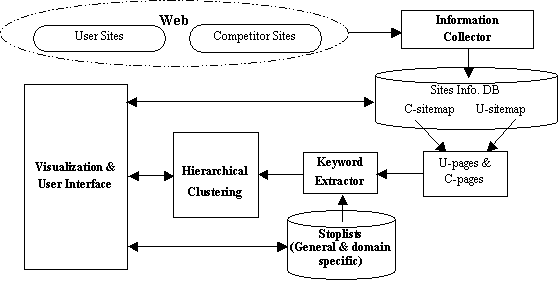
We have implemented a Web sites comparison and visualization system based on the proposed technique. The system is called VSComp, which is coded in Visual C++ under the Window's environment. It consists of 4 main components (a block diagram of the system architecture is shown in Figure 5):|
|
- A multi-thread information collector: It crawls a Web site to download all its pages (we use a similar crawling method as that in [24]). After crawling, a sitemap [21] is built to allow the user to choose any subset of pages for comparison.
- A keyword extractor: It extracts keywords from a Web page, and performs the standard operations of eliminating stopwords, and word stemming. We use the Smart system [29] for this purpose.
- A hierarchical clustering component: It clusters the user selected C pages and U pages together for site comparisons.
- A visualization and user interface component: It visualizes the results and allows the user to interact with the system.
5. EVALUATION
This section evaluates the proposed technique and system. We first use two real-life examples from two different domains to show the working of the system and to illustrate how different functions provided by the system can be exploited for finding interesting C pages and information from them. We then compare VSComp with a previous system through our experiences.5.1. Running Examples
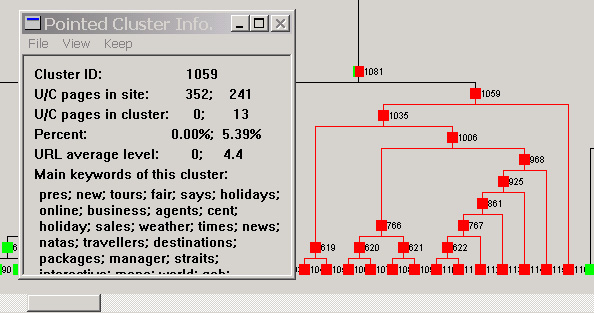
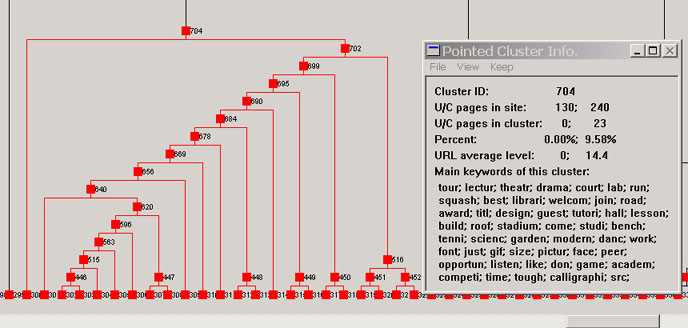
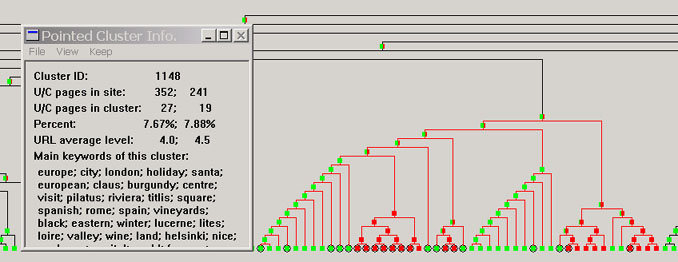
In the two running examples, the first user site is a travel site. Its competitor site is provided by the user. At the time of writing this paper, there are 352 and 241 pages at these two sites respectively. The second user site is a junior college site. The competitor site is another junior college site. At the time of writing this paper, there are 130 and 240 pages in these two sites respectively. Note that in the visualization, we could not reveal the user site names due to confidentiality reasons. Their sites' URLs are masked with "Document URL" on the screen (as we saw in Figure 4). However, keywords from the Web documents will be shown to facilitate understanding. The proposed technique and visualization are versatile and can be used to find many types of interesting pages and information. In the following, we only show a few main types to illustrate the use of the system. Note also that some unnecessary parts of the figures are discarded to save space (the user can rearrange objects on the screen to give a better view). Unexpected C pages (or clusters): These pages or clusters exist at the C site but not at the U site. As discussed previously, such pages are unexpected and often very interesting. In our visualization, these pages or clusters are colored completely in red. In Figure 6, we highlighted cluster 1059, which has 13 C pages (5.39% of the total C pages) and it is a pure red cluster - all pages come from the competitor's site. As related pages are clustered together, this gave the user a surprise because it means that the competitor site used 5.39% of their Web pages to devote to something that the user site did not have at all. It was found (from the keywords on the screen and also the actual pages) that these pages were about the company's history, news and press information (it can also be seen from the other display windows that provide URLs, which are not given here.). The user site did not have any such press release or company news information. The user felt that they should add such information to their site to improve their publicity and public relation. Another example comes from the college domain. Figure 7 shows the example. It was found that the competitor site used 9.58% of their total pages on tours of their college, while the user site did not provide any such online tour of their college. The user found that this was quite important as such online tour pages can help prospective students (or their parents) know their college better before applying to the college.|
Figure 6. An example of unexpected C pages: travel application
Figure 7. An example of unexpected C pages: college application |
|
Figure 8. An example of unbalanced business emphasis: travel application |
|
Figure 9. Finding expected pages: travel domain |
|
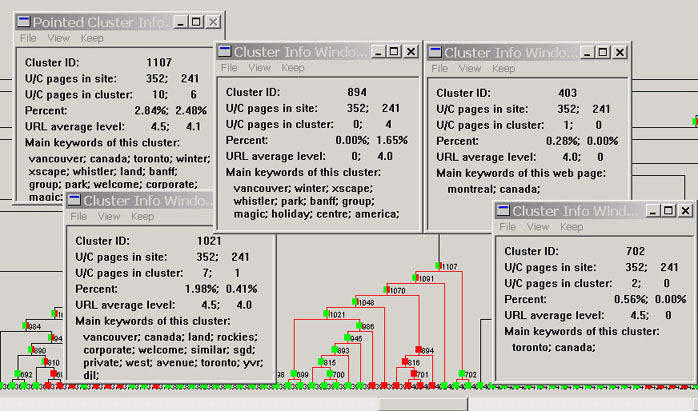
Figure 10. Drilling down the cluster tree: travel application
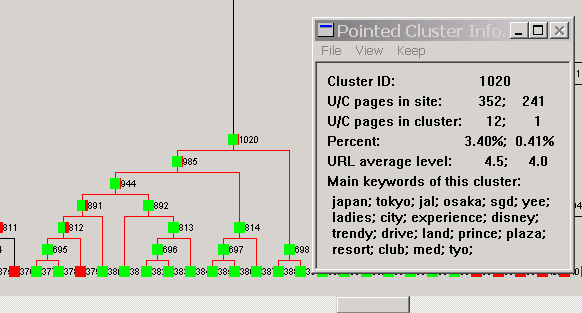
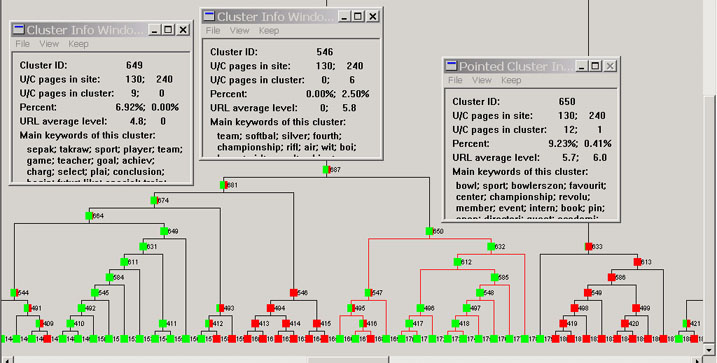
Figure 11. Drilling down the cluster tree: college application |
5.2. Application Experiences
Since the proposed technique deals with something subjective, it is difficult to have an objective measure of its performance. Here, we report our application experiences and compare our VSComp system with an existing system (called WebCompare) [21], which, to the best of our knowledge, is the only system that is able to perform Web site comparisons. We have carried out a number of experiments involving our users to check whether the new system is indeed superior. Our users were from two organizations: a travel agency, and an educational institution. Each of them compared their company site with a competitor site. Some of the examples have been shown in Section 5.1. WebCompare [21] compares two sites by using information retrieval and data mining techniques to analyze the keywords in U pages and C pages and to rank the C pages according to various criteria. In terms of techniques, VSComp is different from WebCompare as VSComp uses clustering and visualization, which are not used in WebCompare. These differences result in important consequences. Our experiences show that the new system is superior to the old in two important aspects:- Flexibility: Ranking pages (done in WebCompare) does not give the user sufficient flexibility to explore those aspects that may be of interest to him/her. Those pages that are ranked high may not be those that interest the user because interestingness of information is quite subjective. Ranking is also a global operation, which sorts all the pages in the C site to produce a single list. This list tends to drown those interesting local areas. In our applications of WebCompare, we found that when the top ranking pages were not that interesting, users did not know what to do and became frustrated. In the new system, this does not happen, as the user is able to inspect clusters and pages from anywhere and at any level of granularity. That is, he/she can pick any interesting clusters or pages (i.e., local areas) for further analysis (see Figures 6, 7 and 8). The color effects of the clusters and hierarchical clustering make this very convenient. This cannot be done in WebCompare, which tends to dictate what pages the user should see (through ranking).
- Information overload: WebCompare often returns too much information which overwhelms the user due to its use of the data mining method called association mining (which often produces a huge number of patterns [20]). Without a summarization and visualization system, it is very hard for the user to inspect them in order to find something interesting. Thus, the users often give up. The new system is friendlier. Its clustering system is able to summarize a large number of pages into a small number of clusters to give the user a global picture. He can then choose to drill down to some interesting aspects.
