Extracting information from tables requires that we first locate the tables in the document. In HTML pages, the TABLE element, originally designed to encode tabular data, is more often used to control the layout of arbitrary elements on the page. This paper describes a machine learning approach to identifying which TABLE elements are true tables.
Keywords : Tables, Machine Learning, Table Understanding.
Relational information - information expressing relationships between a number of different concepts - is frequently presented in human readable documents in a tabular form.
The majority of tables expressed by orthogonal rows and columns may be encoded by the TABLE element and its associated legal sub-elements (TBODY, THEAD, TFOOT, TR, TH and TD). There are many other features of HTML that may be brought to bear on the rendering of these encodings which provide almost arbitrary control of the layout of elements on the page. Consequently, tabular data on the web is lost in the noise of the extended uses of the TABLE element (see Figure 1). Our intuition is that the proportion of TABLE elements that encode true tables is quite small : experiments suggest as low as 10%.

| |
Figure 1 : The top page of www.statistics.com contains 44 TABLE tags, but none of these could be said to contain tabular data. |
Informally, a table has the following characteristics ([9], [2]) :
We can distinguish two types of tables in HTML documents - those which have some clear relationship with an instance of the TABLE tag in the HTML document (type 1); and those which are only considered to be tables by virtue of their appearance once rendered by a suitable browser (type 2).
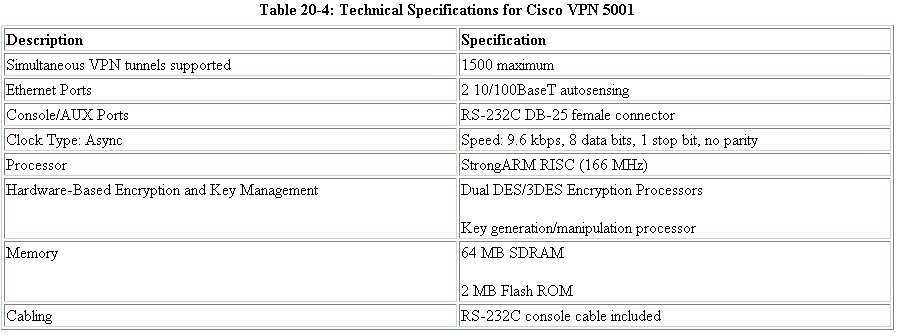
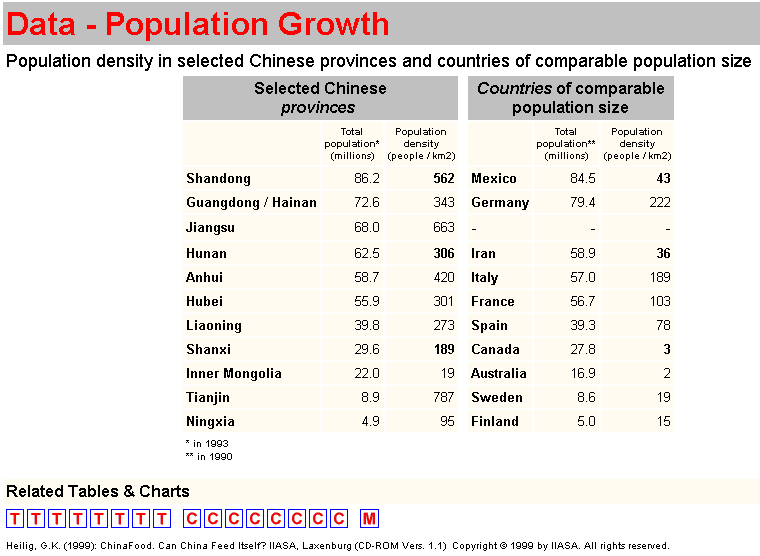
In general, type 1 contains those table instances which are encoded by the `correct' use of the TABLE tag and its legal structure (TABLE, TBODY, TR, etc.) - for example the table in Figure 2; as well as those cases where the table is embedded in a TABLE structure which does not represent the entire content of the table structure - for example the table in Figure 3.

|
|
Figure 2 : A simple and `correct' use of the TABLE tag set. |

|
|
Figure 3 : This figure represents the lowest TABLE element surrounding the two tables at the centre. Although this TABLE element contains a table, it cannot be simply be inspected for relational information in, for example, an information extraction system. |
An extension of type 1 is a mixed class in which a table contains other elements (that describe the geometric structure of the table) such as images that depict a number of cells, plain text wrapped in a PRE tag which represents a number of rows in the tables, the use of UL tags, BR tags, and so on.
Type 2 contains such things as images, plain text tables, the use of HTML elements that are not explicitly related, other than via a sibling relationship of some sort, etc. See Figure 4 for an example.
Figure 4 : www.mysimon.com uses tables to display results of product searches for comparison. However, each row in the table is a TABLE element, and the whole table is not composed within a TABLE element. Therefore, inference is required to discover what appears to the reader as a clear example of tabular data. |
Here we concentrate on the first type of tables. We cast the table location problem as a classification problem. The problem is to determine for each TABLE node in the DOM the correct label : positive or negative. A positive label indicates that we believe that this TABLE node is a true table, or that it contains a true table.
Prior work in this area (e.g. [1]) has suggested that the number of true data tables on the web is low (e.g. 28.53% for the Chinese flight schedule domain). In general, statistics describing the distribution of features on the web are hard to interpret due to the potential burstiness of characteristics: a feature may be rare in general, but common on one particular site. However, what the above results suggest supports our intuitions about the proliferation of alternative uses for the TABLE tag.
Our approach adopts a standard machine learning classification paradigm. We take a set of documents which we mark up to indicate the positive TABLE elements. All other table elements are, implicitly, negative instances.
We then extract a set of features representing the TABLE. There are two classes of features. The first are extracted from the HTML (DOM) representation of the document. The second class are model based features. Because HTML is a structural representation of the document (which is different from a representation of the document structure) it does not reflect the two dimensional geometric aspect of the table. The construction of this geometric table model is similar to the rendering of the table as it appears in a browser, however it allows for more sophistication. We can use a number of complex processes to consider how the HTML may be presented in the browser and then infer the geometric table model. For example, nested tables, in certain situations, might be collapsed into the parent table to provide a geometric description of the overall document object. The geometric model of the table describes the location and content of the cells.
The extracted set of features (the feature vector) is associated with a label. This training data is then used to train a classifier. We trained and tested a number of classifier systems using technology developed at WhizBang!Labs. These included a Naive Bayes Classifier(refer to [4] for details), Maximum Entropy Classifier ([5]), Decision Tree Classifier ([4]) and a Winnow Classifier ([3]).
Linguistic models typically describe natural language in terms of syntax and semantics. Models exist which describe tables in similar terms (see [2]). However, deriving such descriptions of tables from layout information such as HTML is non-trivial. A more immediate and attainable abstract representation of tables can be found in the geometric model.
Deriving a geometric model of a table from an HTML source is similar to the process of rendering the table in a browser.
The approach adopted for generating the table model is as follows:
In the last step, the model is modified through further analysis to reflect what we hope is the perceived geometric arrangement of content (usually text) on the page. This analysis accounts for nested tables, the use of explicit line breaks, lists and so on.
We ran a number of experiments in order to determine how these features benefited the training of classifiers. We tested the feature sets individually and in combination.
The experimental procedure was as follows. We took our marked up data which consisted of 89 positive examples and 250 negative examples and took the performance of a classifier trained on a random sample of 25 % of the data, tested on the remaining 75 %, averaged over 5 tests.
Each experiment was performed over a number of trainable classifier algorithms. The results for the Naive Bayes and Winnow classifiers are presented here (being the best performing classifiers).
The results show that Naive Bayes performs best with the combination of feature sets whereas Winnow performs best using only the model based feature set.
|
|
For Naive Bayes, the results suggest that adding the feature sets together results in the best performance. However, the clear winner is the Winnow classifier using only the model features.
Other methods for TABLE element classification use the content domain. For example ([1]) reports the use of similarity of cells with respect to the semantic type of the content, e.g. a column of TD elements all containing a time or date would be a strong indicator.
The method reported in [6] consists of a set of heuristics which check for certain features of the table, including if the TABLE element is a leaf TABLE element, the number of rows and columns, and features of the content of the cells. In general, these features can be extracted and incorporated in a learnable classifier.
The approach presented here is novel in two respects: its application of machine learning methods for locating true tables on web pages, and the use of a specific geometric model of the table from which features instrumental to the success of the method are extracted.