Virgílio A.F. Almeida
Daniel A. Menascé![]() Bruno D.
Abrahão
Bruno D.
Abrahão![]() Daniel Barbará
Daniel Barbará![]()
Virgílio A.F. Almeida![]() Flávia P. Ribeiro
Flávia P. Ribeiro![]()
| Dept. of Computer Science | Dept. of Computer Science | |||
| George Mason University | Universidade Federal de Minas Gerais | |||
| Fairfax, VA 22030 USA | Belo Horizonte, MG 31270 Brazil | |||
| +1 703 993 1537 | +55 31 3499 5860 | |||
| menasce@cs.gmu.edu | {brut,virgilio,flavia}@dcc.ufmg.br |
| Dept of Information and Software Engineering | |
| George Mason University | |
| Fairfax, VA 22030 USA | |
| +1 703 993 1627 | |
| dbarbara@gmu.edu |
Keywords: Web workload characterization, e-commerce,
fractal clustering, fractal dimension, ![]() -means clustering.
-means clustering.
Word count: 6,300.
Understanding the workload of Web and e-commerce sites is a fundamental step in sizing the IT infrastructure that supports these sites and in planning for their evolution so that Quality of Service (QoS) goals are met within cost constraints [12]. The first attempts at characterizing the workload of Web sites focused on information providing sites and considered only the stream of HTTP requests coming to the sites [3,4,8].
Some of the characteristics analyzed in previous studies are: file size distributions, file popularity distribution, self-similarity in HTTP traffic, reference locality, and user request patterns. A number of studies of different Web sites found that file sizes have heavy-tailed distributions and that the relationship between object popularity and frequency of access follows a Zipf distribution. Other studies of different Web site environments demonstrated long-range dependencies in the user request process, primarily resulting from strong correlations in the user requests.
More recently [13], the authors proposed a characterization approach for e-commerce workloads that takes into account the user model and its interactions with the e-commerce site. In particular, they proposed a hierarchical view of the workload consisting of a session layer, a function layer, and protocol (i.e., HTTP) layer. A session is a sequence of requests of different types made by a single customer during a single visit to a site. During a session, a customer requests the execution of various e-business functions such as browse, search, select, add to the shopping cart, register, and pay. A request to execute an e-business function may generate many HTTP requests to the site. For example, several images may have to be retrieved to display the page that contains the results of the execution of an e-business function. Using this approach to characterize the workload of online bookstores and auction sites, they were able to show, among other things, that i) most sessions last less than 1,000 sec, ii) more than 70% of the functions performed are product selection functions as opposed to product ordering functions, iii) the popularity of search terms follows a Zipf distribution, iv) there is a very strong correlation in the arrival process at the HTTP request level, indicated by a Hurst parameter with a value of 0.9273, v) at least 16% of the requests are generated by robots, vi) 88% of the sessions have less than 10 requests to execute e-business functions, and vii) the session length, measured in number of requests to execute e-business functions, distribution is heavy-tailed, especially for sites subject to requests generated by robots.
One of the main potential benefits of properly characterizing the workload is improve the quality of a customer's experience at the site. Once one understands what customers do, what navigational patterns they follow, one can improve their experience and even attempt to dynamically identify a customer with a well-known behavior in order to provide a better experience for the customer, i.e., personalized services, and maybe generate more profit to e-commerce sites.
Menascé and Almeida proposed two approaches to characterize user sessions: Customer Behavior Model Graphs (CBMGs) and Customer Visit Models (CVMs) [14]. The CBMG is a state transition graph, in which the nodes correspond to states in the session (e.g., browsing, searching, selecting, checking out, and paying) and the arcs correspond to transitions between states. Probabilities are associated with transitions as in a Markov Chain. In [15], a clustering-based method was presented to process HTTP logs and obtain clusters of CBMGs with ``similar'' patterns (e.g., heavy buyers, occasional buyers).
A Customer Visit Model (CVM) represents sessions as a
collection of session vectors, one per session. A session
vector
![]() for the j-th
session indicates the number of times,
for the j-th
session indicates the number of times,
![]() , that each of
the
, that each of
the ![]() different functions (e.g., search,
browse, add to cart, etc) were invoked during the session. In
this paper, we use clustering techniques based on the CVM model
rather than on the CBMG since the CVM is a more compact
representation of the workload than a CBMG. This reduces the
number of attributes that have to be considered. More
importantly, we use the fractal dimension [17] to reduce the
dimensionality of the space and extract the most relevant
attributes that should be used to characterize the workload.
Besides using distance-based clustering algorithms (e.g.,
k-means, minimum spanning tree), as done in [15], we use fractal clustering
(FC) [5]. One of
the motivations for using fractal clustering is to improve the
``quality'' of the clusters so that one can assign meaningful
interpretations to each of them. Fractal clustering is quite
appropriate to find sets of points that are ``similar'' with
respect to a fractal dimension. This implies that clusters do
not have to be shaped as hyperspheres, as is the case with
distance-based clustering approaches. In this paper, we compare
the results obtained with fractal clustering and distance-based
clustering on a dataset generated from an e-commerce
workload.
different functions (e.g., search,
browse, add to cart, etc) were invoked during the session. In
this paper, we use clustering techniques based on the CVM model
rather than on the CBMG since the CVM is a more compact
representation of the workload than a CBMG. This reduces the
number of attributes that have to be considered. More
importantly, we use the fractal dimension [17] to reduce the
dimensionality of the space and extract the most relevant
attributes that should be used to characterize the workload.
Besides using distance-based clustering algorithms (e.g.,
k-means, minimum spanning tree), as done in [15], we use fractal clustering
(FC) [5]. One of
the motivations for using fractal clustering is to improve the
``quality'' of the clusters so that one can assign meaningful
interpretations to each of them. Fractal clustering is quite
appropriate to find sets of points that are ``similar'' with
respect to a fractal dimension. This implies that clusters do
not have to be shaped as hyperspheres, as is the case with
distance-based clustering approaches. In this paper, we compare
the results obtained with fractal clustering and distance-based
clustering on a dataset generated from an e-commerce
workload.
The rest of this paper is organized as follows. Section 2 briefly summarizes the results of previous work relevant to this paper. Section 3 discusses fractal dimension and its application to Web workloads and shows, through the use of Pair-count plots, that the workload analyzed is fractal in nature. The next section presents the results of applying fractal clustering to our Web workloads and offers an interpretation of the resulting clusters. Section 5 presents the results of performing attribute selection (i.e., dimension reduction) to our Web workloads. Section 6 compares FC with k-means clustering on the same dataset. Finally, section 7 presents some concluding remarks.
While there are many references on workload characterization in the WWW focusing on information provider Web sites [4], there is much less work on workload characterization for e-commerce sites.
In [7], the notion of a session which consists of many individual HTTP requests is introduced. Reference [14] presents several models (e.g., the Customer Behavior Model Graph and the Customer Visit Model) and shows how user sessions can be represented by these models and how to obtain them from HTTP logs. In [13], the authors use a hierarchical model to characterize e-commerce workloads from a real Web store log. This method takes into account, not only requests for files, but also user sessions consisting of requests for e-commerce functions (i.e., add to cart and pay). In addition, they detect and characterize some entities widely mentioned in this work as Shopbots and Crawlers. They also present the summary and the characteristics of the Webstore log we are using in this work.
In the database field, fractal dimension has been proven to
be a suitable tool to estimate spatial joins and range
queries [6],
indexing and feature selection [17] amongst others. A good
coverage of fractal dimension, including the correlation
fractal dimension ![]() , is given by
Belussi [6].
As well as presenting the concepts behind those metrics, they
also show an efficient algorithm to compute them.
, is given by
Belussi [6].
As well as presenting the concepts behind those metrics, they
also show an efficient algorithm to compute them.
In [10],
the Pair Count Exponent power law is presented and its
application to estimating the selectivity on spatial joins
queries. As a special case, it includes ![]() . Since our datasets follow this perfect power
law, it motivated us to examine the fractal properties of our
workload.
. Since our datasets follow this perfect power
law, it motivated us to examine the fractal properties of our
workload.
Last, the method used to perform attribute selection in our datasets is described in [17]. In addition to presenting the algorithm, they also show results using real and synthetic databases. We are using the Fractal Clustering algorithm (FC) proposed by Barbará et. al. [5] to cluster datasets of n-dimensional points and group them in clusters not restricted by its shape.
Many phenomena observed in nature seem to have chaotic
behavior, but many, under close inspection, exhibit patterns
that repeat themselves as the observation scale varies. These
patterns are called fractals and the phenomenom is
called self-similarity [5,11]. Self-similarity has been
observed in many phenomena related to computer systems and to
Web and e-commerce workloads. For example, the number of bytes
retrieved from a Web server in time slots of duration ![]() is a self-similar process
over a wide range of values of
is a self-similar process
over a wide range of values of ![]() [8].
So, is the number of HTTP requests arriving at an e-commerce
site over a time slot of duration
[8].
So, is the number of HTTP requests arriving at an e-commerce
site over a time slot of duration ![]() [13].
[13].
One of the goals of this work is to use fractal properties
to refine the characterization of e-commerce workloads. These
workloads are characterized at higher levels of abstraction,
i.e., sessions as opposed to HTTP requests. For that purpose,
we analyzed large HTTP logs of an online bookstore. The logs
correspond to 15 days in which 955,818 HTTP requests were
processed. Entries corresponding to images, errors, etc were
deleted and the URLs of the remaining entries in the log were
mapped to one of 12 e-business functions defined in
Table 1.
| Function Name | Description |
| Acc | Account Login and Creation |
| Add | Add items to the cart |
| Browse | Navigate through product categories |
| Help | Obtain help |
| Home | Request the site's home page |
| Info | Obtain product information |
| Pay | Pay for an item |
| Postpay | Request a summary of items paid for |
| Prepay | Submit payment info |
| Robot | Request the file robot.txt |
| Search | Search for products based on keywords |
| Undef | Undefined function |
Then, sections within the log were identified using a
combination of session ids generated by the online bookstore
and a 30-minute inactivity period threshold [14]. A session vector
![]() was
generated for each session. This vector indicates the number of
times,
was
generated for each session. This vector indicates the number of
times,
![]() , that each of
the 12 different functions (e.g., Search, Browse, Add) was
invoked during the session. The resulting dataset is what we
call the complete dataset. We define the session
length,
, that each of
the 12 different functions (e.g., Search, Browse, Add) was
invoked during the session. The resulting dataset is what we
call the complete dataset. We define the session
length, ![]() , as the total number of requests
to execute e-business functions during the session. So,
, as the total number of requests
to execute e-business functions during the session. So,
![]() .
.
We derived three additional datasets from the complete dataset. One, called UpTo50, only includes session vectors with session length not exceeding 50. By considering only sessions whose length does not exceeed 50, we exclude sessions generated by robots and a few sessions generated by human beings as well. It should be noted however that the UpTo50 log contains 99.5% of the sessions of the complete log. This log can be used to focus on human-generated requests only.
The other dataset, called Add, includes sessions in
which customers had an intention to buy. This is indicated by
![]() , i.e., at least
one item was placed in the shopping cart. The other dataset,
called Pay, includes sessions in which
, i.e., at least
one item was placed in the shopping cart. The other dataset,
called Pay, includes sessions in which
![]() and
and
![]() and
and
![]() , i.e.,
sessions in which a purchase occurred.
, i.e.,
sessions in which a purchase occurred.
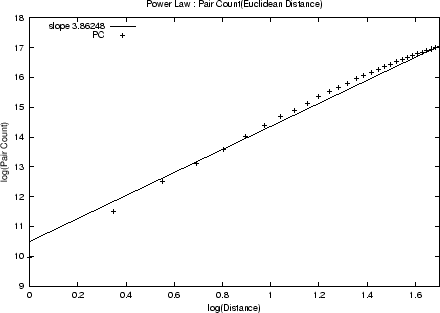
As a preliminary investigation of the fractal nature of our
datasets, we used the method in [10] to obtain the
pair-count plot or PC-plot of the dataset. The pair count, ![]() , of a dataset for a given
radius
, of a dataset for a given
radius ![]() is defined as the number of pairs
in the dataset in which points are within a distance
is defined as the number of pairs
in the dataset in which points are within a distance ![]() of each other. The study
in [10] showed
that
of each other. The study
in [10] showed
that ![]() follows a power law for many
real datasets for a usable range of distances. In other words,
follows a power law for many
real datasets for a usable range of distances. In other words,
![]() where
where ![]() is a constant and the exponent
is a constant and the exponent
![]() is called the pair-count
exponent. The PC-plot is then a plot of
is called the pair-count
exponent. The PC-plot is then a plot of ![]() vs.
vs. ![]() .
Clearly, if
.
Clearly, if ![]() follows a perfect
power law, the PC-plot is a straight line for a given range of
distances. The pair-count exponent is the slope of the straight
line in the PC-plot and is also the ``correlation fractal
dimension''
follows a perfect
power law, the PC-plot is a straight line for a given range of
distances. The pair-count exponent is the slope of the straight
line in the PC-plot and is also the ``correlation fractal
dimension'' ![]() [10,17] discussed later in this
section. This is also called the intrinsic dimensionality of
the dataset.
[10,17] discussed later in this
section. This is also called the intrinsic dimensionality of
the dataset.
Figure 1 shows the
PC-plot for the complete dataset. The distance metric used is
the Euclidean distance and the natural logarithm was used for
both axes. As expected [10], similar results
were obtained with the Manhattan distance [9] and when the dataset was
sampled. As it can be seen, for a range of distances ranging
from 1 (![]() ) to 5.5 (
) to 5.5 (![]() ) the PC-plot is pretty much linear with a
slope (i.e., correlation fractal dimension) of approximately
3.86.
) the PC-plot is pretty much linear with a
slope (i.e., correlation fractal dimension) of approximately
3.86.
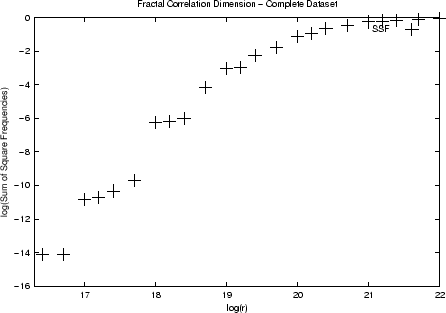
A closer look at the PC-plot in Figure 1 reveals that the plot has
some inflection points, which indicates the presence of more
than one fractal cluster. In order to better analyze the
fractal dimension of the dataset, we can refer to
Figure 2 that
uses the approach in [6]. The idea is to
partition the space into a grid of ![]() -dimensional cells of side equal to
-dimensional cells of side equal to ![]() . We then count the number of points in the
. We then count the number of points in the ![]() -th cell of side
-th cell of side ![]() and compute the frequency,
and compute the frequency, ![]() , in which points fall within cell
, in which points fall within cell ![]() , i.e., the count of points in the
cell divided by the total number of points in the dataset. The
``correlation fractal dimension''
, i.e., the count of points in the
cell divided by the total number of points in the dataset. The
``correlation fractal dimension'' ![]() is
then defined as
is
then defined as
| (1) |
for the range ![]() in which the
dataset is self-similar [10,17]. The correlation fractal
dimension is quite useful in data mining and measures the
probability that two points chosen at random will be within a
certain distance from each other [5].
in which the
dataset is self-similar [10,17]. The correlation fractal
dimension is quite useful in data mining and measures the
probability that two points chosen at random will be within a
certain distance from each other [5].
Figure 2 plots
the log of the sum of the squares of the cell occupancy
frequencies vs. the log of ![]() . Thus,
the slope of this graph in selected ranges is the fractal
dimension of the dataset. The figure shows that the dataset is
self-similar but that there is more than one range with
different values of
. Thus,
the slope of this graph in selected ranges is the fractal
dimension of the dataset. The figure shows that the dataset is
self-similar but that there is more than one range with
different values of ![]() .
.
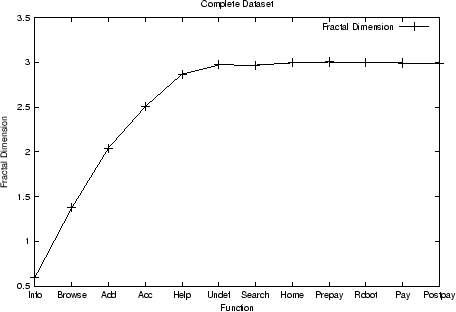
Our original dataset has dimension equal to 12 since there are 12 e-business functions in the session vector. Some of the attributes may not be relevant when attempting to group sessions into clusters. We examine in this section how one can select the relevant attributes in a dataset. Since we intend to use fractal clustering (see Section 3), which places points in clusters by taking into account the fractal dimension of each cluster, we use the fractal dimension as the criterium for attribute selection.
The basic process works as follows. We start by computing
the fractal dimension ![]() of the
complete dataset. Then we examine one attribute (say attribute
of the
complete dataset. Then we examine one attribute (say attribute
![]() ) at a time and compute the partial
fractal dimension
) at a time and compute the partial
fractal dimension ![]() , defined as the
fractal dimension of the dataset using all attributes except
attribute
, defined as the
fractal dimension of the dataset using all attributes except
attribute ![]() . Select the attribute
. Select the attribute ![]() such that
such that
![]() . Set
. Set ![]() equal to
equal to ![]() and remove attribute
and remove attribute ![]() from the
dataset. The process continues until all attributes have been
removed.
from the
dataset. The process continues until all attributes have been
removed.
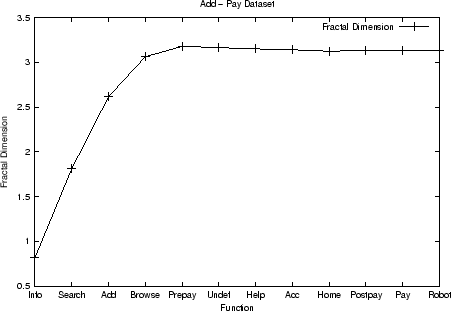
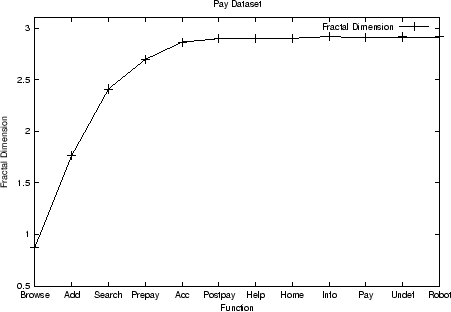
Figure 3
shows the results of applying this process to the complete
dataset. The y-axis value for a given attribute ![]() is the partial fractal dimension before the
attribute is removed. The order in which attributes are removed
as a result of executing the procedure outlined above is from
right to left. So, as the figure shows, removing Postpay
through Undef does not significantly change the fractal
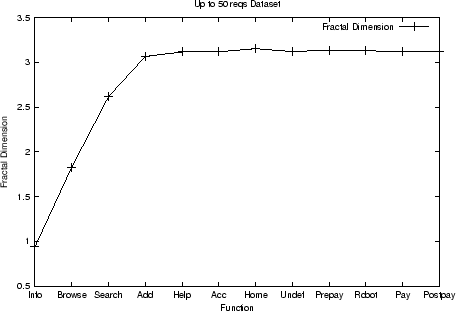
dimension of the dataset. Similar results for the UpTo50, Add,
and Pay datasets, are shown in Figs. 4, 5, and 6, respectively. These
results indicate that fractal clustering analysis of these
datasets can be carried out with a number of attributes much
smaller than the original 12.
is the partial fractal dimension before the
attribute is removed. The order in which attributes are removed
as a result of executing the procedure outlined above is from
right to left. So, as the figure shows, removing Postpay
through Undef does not significantly change the fractal
dimension of the dataset. Similar results for the UpTo50, Add,
and Pay datasets, are shown in Figs. 4, 5, and 6, respectively. These
results indicate that fractal clustering analysis of these
datasets can be carried out with a number of attributes much
smaller than the original 12.
Finding correlations between attributes is important in
explaining user behavior. These correlations can be found
through the use of association rules [1]. The data is assumed to be a
basket of items, which in its simplest form is a vector of
binary values: an item is either in the basket or it is not.
This technique finds rules of the form
![]() , where
, where ![]() and
and ![]() are
itemsets in the data, i.e., sets of items. The rule
comes with two measures: the support, which indicates
the probability of the itemset
are
itemsets in the data, i.e., sets of items. The rule
comes with two measures: the support, which indicates
the probability of the itemset ![]() ,
, ![]() in the data set (number of times
in the data set (number of times
![]() and
and ![]() occur
together in the baskets divided by the number of baskets), and
the confidence, or probability that
occur
together in the baskets divided by the number of baskets), and
the confidence, or probability that ![]() occurs in the baskets already containing
occurs in the baskets already containing ![]() (number of times
(number of times ![]() and
and ![]() occur together in the
baskets divided by the number of baskets containing
occur together in the
baskets divided by the number of baskets containing ![]() ). The rules by themselves do not
indicate correlation.
). The rules by themselves do not
indicate correlation.
However, a different measure, called the lift of the
rule, defined as the ratio between the confidence and the
probability of the consequent (in our example the itemset ![]() ) is useful in establishing
correlations. A lift greater than 1 indicates a positive
correlation and a lift less than 1 a negative correlation.
) is useful in establishing
correlations. A lift greater than 1 indicates a positive
correlation and a lift less than 1 a negative correlation.
In our logs, we took as the baskets the sessions, as items
the presence or absence of the functions (attributes of the
log). For instance, one can have the item ![]() or
or
![]() , indicating
whether the session used the browse function or not.
, indicating
whether the session used the browse function or not.
The most interesting correlations were found in the Pay dataset and are shown in Table 2.
The first two indicate a strong correlation between browsing and visiting the information pages (the customer either uses both or none). The third one indicates that when the rule is broken (the customer does not use the browsing function, but visits the information pages), then the search function is commonly used.
This section presents the results of performing FC on the online bookstore dataset and offers an interpretation of the resulting clusters. The FC algorithm used is described in [5]. There, the authors presented a novel algorithm for clustering data points, based on exploiting self-similarity. This algorithm, named FC for Fractal Clustering, incrementally processes each point by placing it in the cluster in which it causes the minimum fractal impact, that is the cluster whose fractal dimension changes the least when the point is added to it.
Since the workload data sets exhibit a high degree of
self-similarity, we wanted to use FC to cluster them, showing
the advantage that FC exhibits over other clustering methods
such as ![]() -means.
-means.
The results of using FC over the complete set of web logs are shown in Table 3 in the form of the centroids of the three clusters found. The last column indicates the percentage of points in each cluster. The three clusters correspond to human sessions, since the robot sessions were considered as outliers by FC (and form a fourth very small cluster). The clustering was done in a reduced-attribute set of five attributes: add, browse, home, info, and search. The centroids suggest the presence of three groups of human sessions, whose main difference is the intensity on using the functions.
| Cluster | add | browse | home | info | search | % |
| 1 | 0.251 | 0.772 | 0.778 | 0.811 | 0.944 | 96.6 |
| 2 | 3.148 | 6.312 | 1.963 | 6.553 | 5.100 | 2.57 |
| 3 | 5.027 | 8.699 | 3.208 | 10.321 | 8.732 | 0.83 |
Clustering techniques based on the definition of a distance
(e.g., Euclidean or Manhattan) are commonly used. Some examples
of these algorithms include ![]() -means,
minimum spanning tree, and others [9]. The purpose of this
section is to compare results obtained with k-means and FC
clustering with respect to the quality of the clusters obtained
and the interpretations obtained from them.
-means,
minimum spanning tree, and others [9]. The purpose of this
section is to compare results obtained with k-means and FC
clustering with respect to the quality of the clusters obtained
and the interpretations obtained from them.
The k-means algorithm chooses ![]() points as
the initial
points as
the initial ![]() clusters and adds each
remaining point to the closest cluster using a predefined
distance metric. Every time a point is added to a cluster, the
coordinates of the centroid of the cluster have to be
recomputed [9]. Point
allocation to clusters may have to be repeated until no points
change their cluster allocation or a maximum number of passes
is performed.
clusters and adds each
remaining point to the closest cluster using a predefined
distance metric. Every time a point is added to a cluster, the
coordinates of the centroid of the cluster have to be
recomputed [9]. Point
allocation to clusters may have to be repeated until no points
change their cluster allocation or a maximum number of passes
is performed.
We present in Tables 4, 5, and 6 the results of applying ![]() -means clustering to our e-commerce workload,
where, as before, each point is a session vector. Table 4 shows the results of applying
-means clustering to our e-commerce workload,
where, as before, each point is a session vector. Table 4 shows the results of applying
![]() -means clustering to the complete
log using 5, 6, and 7 clusters. Only seven--acc, add, browse,
home, info, pay, and search--of the twelve attributes were used
in the clustering processes. Using more attributes did not
improve the quality of the clustering process. For each number
of clusters, the table shows the coordinates of the centroid
for each cluster. These coordinates represent the average
number of executions of each of the seven e-business functions
by sessions represented by that cluster. Column 9 indicates the
percentage of sessions in each cluster. The next column, S,
indicates the sum of the number of executions of each of the
seven e-business functions for that cluster. This sum can be
considered as the session length restricted to these seven
functions. The last column of the table presents a possible
interpretation for the type of sessions represented by each
cluster.
-means clustering to the complete
log using 5, 6, and 7 clusters. Only seven--acc, add, browse,
home, info, pay, and search--of the twelve attributes were used
in the clustering processes. Using more attributes did not
improve the quality of the clustering process. For each number
of clusters, the table shows the coordinates of the centroid
for each cluster. These coordinates represent the average
number of executions of each of the seven e-business functions
by sessions represented by that cluster. Column 9 indicates the
percentage of sessions in each cluster. The next column, S,
indicates the sum of the number of executions of each of the
seven e-business functions for that cluster. This sum can be
considered as the session length restricted to these seven
functions. The last column of the table presents a possible
interpretation for the type of sessions represented by each
cluster.
| Cluster | acc | add | browse | home | info | pay | search | % | S | Interpr. |
| 5 clusters | ||||||||||
| 1 | 0.7 | 5.2 | 4.0 | 1.8 | 4.9 | 0.0 | 232.7 | 2.0 | 249 | shopbots |
| 2 | 3.8 | 2.7 | 2.4 | 1.9 | 2.2 | 1.0 | 2.9 | 0.2 | 17 | buyers |
| 3 | 0.1 | 0.1 | 0.5 | 0.0 | 0.8 | 0.0 | 2.9 | 60.7 | 4 | hit&run |
| 4 | 0.1 | 0.1 | 0.8 | 1.2 | 0.7 | 0.0 | 0.8 | 34.5 | 4 | hit&run |
| 5 | 59.0 | 53.5 | 1384.2 | 118.6 | 1290.7 | 0.0 | 81.2 | 0.0 | 2987 | crawlers |
| 6 clusters | ||||||||||
| 1 | 1.2 | 0.3 | 0.8 | 0.5 | 0.7 | 0.0 | 94.8 | 5.9 | 98 | shopbots |
| 2 | 3.8 | 2.7 | 2.4 | 1.9 | 2.2 | 1.0 | 2.9 | 0.2 | 17 | buyers |
| 3 | 0.0 | 0.1 | 0.5 | 0.0 | 0.8 | 0.0 | 1.3 | 56.9 | 3 | hit&run |
| 4 | 0.0 | 0.1 | 0.8 | 1.2 | 0.7 | 0.0 | 0.8 | 32.4 | 4 | hit&run |
| 5 | 59.0 | 53.5 | 1384.2 | 118.6 | 1290.7 | 0.0 | 81.2 | 0.0 | 2987 | crawlers |
| 6 | 0.7 | 5.2 | 4.0 | 1.8 | 5.0 | 0.0 | 4.6 | 1.9 | 21 | chm |
| 7 clusters | ||||||||||
| 1 | 1.2 | 0.0 | 0.5 | 0.3 | 0.4 | 0.0 | 122.0 | 4.7 | 124 | shopbots |
| 2 | 3.8 | 2.7 | 2.4 | 1.9 | 2.2 | 1.0 | 2.9 | 0.3 | 17 | buyers |
| 3 | 0.0 | 0.0 | 0.5 | 0.0 | 0.8 | 0.0 | 1.3 | 55.2 | 3 | hit&run |
| 4 | 0.0 | 0.0 | 0.7 | 1.2 | 0.6 | 0.0 | 0.7 | 30.6 | 3 | hit&run |
| 5 | 59.0 | 53.5 | 1384.2 | 118.6 | 1290.7 | 0.0 | 81.2 | 0.0 | 2987 | crawlers |
| 6 | 0.9 | 7.8 | 6.0 | 2.2 | 7.5 | 0.0 | 6.3 | 0.8 | 31 | chm |
| 7 | 0.2 | 1.5 | 1.3 | 0.8 | 1.3 | 0.0 | 1.3 | 8.4 | 6 | chm |
We used the following labels in Tables 4, 5, and 6 to indicate the following categories of sessions:
The characterization of sessions could be useful for planning purposes. It helps to answer questions such as What would be the response time if the percentage of bots increase by 100%? How could one reduce the percentage of chm customers? What kind of customers usually buy? Is there a common reason why customers change their mind?
In each of the three cases (![]() ,
and 7) in Table 4, there is
one cluster of sessions labeled as ``buyers''. One interesting
observation is that the centroid of the ``buyers'' cluster is
the same regardless of the number of clusters selected:
,
and 7) in Table 4, there is
one cluster of sessions labeled as ``buyers''. One interesting
observation is that the centroid of the ``buyers'' cluster is
the same regardless of the number of clusters selected:
![]() . The analysis of the complete log indicates also that shopbots
and crawlers seem to be very well separated for
. The analysis of the complete log indicates also that shopbots
and crawlers seem to be very well separated for ![]() , and 7. The coordinates of the centroid of
the ``crawlers'' cluster is the same in all three cases and the
coordinates of the ``shopbots'' centroid are not much
different. The non robot clusters, referred here as human
clusters, are separated into three groups when
, and 7. The coordinates of the centroid of
the ``crawlers'' cluster is the same in all three cases and the
coordinates of the ``shopbots'' centroid are not much
different. The non robot clusters, referred here as human
clusters, are separated into three groups when ![]() . One is composed of buyers and the other two
belong to the hit & run category. When the number of
clusters is increased to 6 and 7, we start to see a new type of
customer, those who change their mind. In fact, with 7 clusters
we can see that 9.2% of the customers changed their mind, 0.3%
bought something, 85.8% are non-serious customers
(hit&run), and 4.7% are robots.
. One is composed of buyers and the other two
belong to the hit & run category. When the number of
clusters is increased to 6 and 7, we start to see a new type of
customer, those who change their mind. In fact, with 7 clusters
we can see that 9.2% of the customers changed their mind, 0.3%
bought something, 85.8% are non-serious customers
(hit&run), and 4.7% are robots.
| Cluster | acc | add | browse | home | info | pay | search | % | S | D |
| 5 clusters | ||||||||||
| 1 | 82.4 | 74.8 | 1368.8 | 165.9 | 841.3 | 0.0 | 84.5 | 0.0 | 2618 | bots |
| 2 | 1121.0 | 1074.0 | 6955.0 | 2147.0 | 16167.0 | 0.0 | 1122.0 | 0.0 | 28586 | bots |
| 3 | 1.0 | 6.5 | 6.7 | 2.2 | 9.5 | 0.0 | 8.3 | 7.9 | 34 | chm |
| 4 | 0.6 | 1.7 | 1.5 | 1.0 | 1.6 | 0.0 | 1.2 | 57.4 | 8 | chm |
| 5 | 4.0 | 2.8 | 2.5 | 1.5 | 2.8 | 1.0 | 2.8 | 2.2 | 18 | buyers |
| 7 clusters | ||||||||||
| 1 | 16.7 | 14.7 | 336.9 | 30.8 | 418.5 | 0.0 | 17.9 | 0.1 | 835 | bots |
| 2 | 91.1 | 84.3 | 1533.9 | 183.0 | 966.9 | 0.0 | 93.1 | 0.0 | 2952 | bots |
| 3 | 1.1 | 10.4 | 7.6 | 2.8 | 10.7 | 0.0 | 12.8 | 3.1 | 45 | chm |
| 4 | 0.6 | 1.4 | 1.4 | 1.0 | 1.4 | 0.0 | 0.8 | 74.4 | 6 | chm |
| 5 | 4.0 | 2.8 | 2.5 | 1.5 | 2.8 | 1.0 | 2.8 | 3.3 | 18 | buyers |
| 6 | 1121.0 | 1074.0 | 6955.0 | 2147.0 | 16167.0 | 0.0 | 1122.0 | 0.0 | 28586 | bots |
| 7 | 0.8 | 4.1 | 3.1 | 1.6 | 4.2 | 0.0 | 5.1 | 19.1 | 19 | chm |
Table 5 shows the results
when only sessions that added at least one item to the cart are
considered. In this case, the ``buyers'' centroid in the Add
log is the same for 5 and 7 clusters and is very similar to the
``buyers'' centroid in the complete log. We can see that this
log does not provide a clean distinction between shopbots and
crawlers. Still, the bots with a very large number of requests
manage to remain isolated for both ![]() and
7.
and
7.
| Cluster | acc | add | browse | home | info | pay | search | % | S | D |
| 1 | 0.2 | 1.1 | 1.4 | 0.7 | 9.7 | 0.01 | 1.6 | 2.6 | 15 | info |
| 2 | 0.1 | 0.2 | 0.7 | 0.7 | 0.1 | 0.00 | 0.3 | 51.4 | 2 | hit&run |
| 3 | 0.0 | 0.0 | 0.1 | 0.1 | 1.0 | 0.00 | 0.6 | 42.2 | 2 | hit&run |
| 4 | 0.3 | 1.1 | 10.4 | 1.7 | 3.7 | 0.02 | 2.0 | 1.7 | 19 | browsers |
| 5 | 0.2 | 1.2 | 0.6 | 0.7 | 1.1 | 0.01 | 12.7 | 2.0 | 17 | searchers |
Finally, Table 6 shows the
results of applying ![]() -means when robots are
excluded. The results show two ``hit&run'' clusters and
three clusters that show add to cart activity but with product
selection dominated by either info, browsing, or search
requests.
-means when robots are
excluded. The results show two ``hit&run'' clusters and
three clusters that show add to cart activity but with product
selection dominated by either info, browsing, or search
requests.
Looking at the results of Table 3, obtained when FC was performed, we
were able to derive a relationship between the sum of the
variables browse, info, and search and the add variable. This
relationship would not have revealed itself without performing
FC. We then performed Chi-Square tests over the variables ![]() and the sum
and the sum
![]() ,
along with a linear regression between these variables. The
results are summarized in Table 7.
The interesting fact is that the variables are correlated in
all cases (each cluster and complete set), but while the
correlation is positive in Cluster 1 and the complete set, it
is negative in both of the other clusters (the slope of the
regression curve is negative).
,
along with a linear regression between these variables. The
results are summarized in Table 7.
The interesting fact is that the variables are correlated in
all cases (each cluster and complete set), but while the
correlation is positive in Cluster 1 and the complete set, it
is negative in both of the other clusters (the slope of the
regression curve is negative).
Clusters 2 and 3 have significantly more Add activity than
cluster 1 (see Table 3). In
these two cases, as customers increase their product selection
activity, they tend to add less items to the shopping cart
(negative slope). Another interesting difference between the
results obtained between FC and ![]() -means can
be seen by comparing Table 6
for
-means can
be seen by comparing Table 6
for ![]() -means without robots and
Table 3 for FC without robots.
In the first case, there is very little separation due to Add
activity while in the second case the centroids provide a very
clear distinction based on Add to cart activity. It may be more
useful, from a management standpoint, to separate customers
based on their product ordering activity behavior.
-means without robots and
Table 3 for FC without robots.
In the first case, there is very little separation due to Add
activity while in the second case the centroids provide a very
clear distinction based on Add to cart activity. It may be more
useful, from a management standpoint, to separate customers
based on their product ordering activity behavior.
| Cluster | Slope | Constant | Correlation |
| Cluster1 | 3.885e-02 | 0.153 | Correlated |
| Cluster2 | -0.179 | 6.362 | Correlated |
| Cluster3 | -0.206 | 10.754 | Correlated |
| Complete | 3.885e-02 | 0.153 | Correlated |
The interactions of customers of Web and e-commerce sites
are represented by sessions, which are sequences of requests of
different types made by a single customer during a single visit
to a site. During a session, a customer requests the execution
of various e-business functions such as browse, search, select,
add to the shopping cart, register, and pay. In this paper, we
used the Customer Visit Model (CVM) [14] to represent an e-commerce site
workload. A CVM represents sessions as a collection of session
vectors, one per session. A session vector
![]() for the j-th
session indicates the number of times,
for the j-th
session indicates the number of times,
![]() , that each of
the
, that each of
the ![]() different functions (e.g., search,
browse, add to cart, etc) were invoked during the session.
different functions (e.g., search,
browse, add to cart, etc) were invoked during the session.
We used clustering techniques to group ``similar'' sessions and to understand the behavior of users within each cluster. In this paper, we proposed a fractal-based approach to characterize Web workloads. First, we showed how the fractal dimension of the dataset can be used to reduce the number of attributes, i.e., the dimension of the session vector. By analyzing variations in the fractal dimension, the method selects those attributes that are more relevant to the workload characterization. This process leads to a reduced complexity of the Web workload characterization and a better understanding of real workloads.
Then, fractal-based clustering algorithms were used to
identify groups of user sessions that share some common
features. We compared the results of the fractal clustering
with those obtained by traditional clustering techniques, based
on the ![]() -means algorithm. Additional
contributions include the following:
-means algorithm. Additional
contributions include the following:
Obtaining logs from actual e-commerce sites is not trivial due to the proprietary nature of these logs. We were fortunate to be given logs from a real site, that shall remain unnamed for obvious reasons. The results reported in this paper should not be seen as general results that apply to many e-commerce sites but as an application of a methodology, based on fractal clustering, to characterize and reduce the complexity of Web and E-commerce workloads.
The authors would like to thank Ping Chen and Julia Couto for their help in running some of the experiments.
Daniel A. Menascé is a Professor of Computer Science, co-director of the E-Center for E-business, and Director of the MS in E-commerce program at George Mason University.
Bruno D. Abrahão is a student in the BS in Computer Science program at the Federal University of Minas Gerais, Brazil.
Daniel Barbará is an Associate Professor of Information and Software Engineering at George Mason University.
Virgilio Almeida is a Professor of Computer Science at the Federal University of Minas Gerais, Brazil.
Flávia Ribeiro is a Ph.D. student in the Computer Science Department at the Federal University of Minas Gerais, Brazil.