
|
|
Abstract
Usability studies and aesthetics provide several “thumb rules” for improved layout of web pages. The large number of such rules and the considerable variability in web page element characteristics makes it difficult to manually evaluate web pages for conformity to usability guidelines. While automated evaluation of web pages has considerable appeal, it is challenged by the non-linear and complex nature of human perception. In particular, commonly used mathematical abstractions, such as a distance defined on a metric space, are not particularly useful in establishing proximity and hence make determining the level of interaction between two web page elements difficult. In this paper, we propose two perceptually motivated measures - one to capture the relative orientation and the other to capture the notion of proximity - which can be used to ascertain the extent to which two elements will interact. While the measures are universal, we also provide an outline for incorporating these measures into a framework for the automated evaluation of web page layouts. |
Keywords: Proximity, Perception, Layout, Web Page, Graph
Approximate Word Count: 4500
Usability studies and aesthetics provide several “thumb rules” for improved layout of web pages [1, 2]. A non-exhaustive list of some common rules includes [4],
The large number of such rules and the considerable variability in web page element characteristics (a simple text element has the font family, size, weight, style, color etc.), makes it difficult to manually evaluate the extent to which a page conforms to results known from usability studies. Algorithms and techniques that allow for automatic and objective evaluation of web page layouts can thus be quite useful. Even more ambitiously, given the placement and nature of some web page elements, these algorithms and techniques can be used to find the change in layout quality when a specific element is introduced at a certain location. The functional relationship between location and layout quality can then be used to find the most suitable position for an element (for example, a marketing element).
Developing an automated system in its entirety is considerably complex and beyond the scope of a single paper. Here, our focus is on a more fundamental issue. The issue arises from the basic observation that the interaction between two elements is a (non-linear) and monotonically increasing function of their proximity (proximity is in some sense the inverse of “distance”. Elements with high proximity are close to each other). That is to say, that objects which are “nearer” influence each other to a larger extent than objects which are “further” apart. The difficulty lies in the fact that a mathematical abstraction of the concept of “nearness” (or proximity) must necessarily be faithful to the complexities of the human visual system. As we show later, metrics (such as the commonly used Euclidean distance, or the Hausdorff distance) are not suitable abstractions.
We have laid out the rest of the paper as follows. In Section 2, we outline some general notation used in the rest of the paper. In Section 3, we first illustrate why common distance metrics are not suitable for estimating the proximity of two web page elements and then propose two new measures - one of which captures the relative orientation of two elements and the other which uses the orientation to define a measure of proximity between two web page elements. In Section 4, we present some results based on the defined measures and in Section 5 we discuss our overall framework within which these measures become useful. The overall framework is discussed at the end, because we feel that the proposed measures are more universally useful. In a sense, we have prioritized the presentation such that the more important information appears earlier - common rule #4 in the previously discussed rule of good design!
A web page is made up of many elements. Associated with each element are one or more attributes which characterize the element and in some cases control its appearance and behavior. We use the notation e(i) to refer to the ith element and the vector a(i) to refer to the attributes of element e(i). A non-exhaustive list of elements and attributes appears in Table 1.
|
As noted before, the interaction between two elements is a (non-linear) and monotonically increasing function of their proximity. Elements that are “near” interact more than elements that are “further apart”. One of the primary challenges in the automatic evaluation of web page layouts is: how does one define a quantitative measure of proximity?
The straight-forward (and inadequate) approach is based on selecting a suitable measure of distance - a non-negative function defined on a metric space. Thus a function of two variables d(a,b) can be defined on the metric space such that d(a,b) > 0; d(a,b) = 0 iff a = b; d(a,b) = d(b,a) and d(a,b) + d(b,c) > d(a,c).
In the most general sense, the proximity of two objects may be obtained based on the distance between two sets, say A and B, with points derived from e(i) (e(j)) being members of the set A (B). In the simplest case, the sets A and B each have a single point and one can consider the Euclidean distance (or any other norm) between them. For example, the point may be the centroid of the element and the centroid-to-centroid distance be taken as a measure of the proximity between the two elements. The difficulty is that the sizes as well as the geometry (aspect ratio) of the two elements are ignored in this formulation. For example, the centroid-to-centroid distances between the two elements in the left and right panels of Figure 1 are the same. However, the proximity of the elements in the two situations is greatly different.

|
To overcome this difficulty, one may include additional points and increase the cardinality of the sets A and B. A distance measure between two sets A and B can be obtained using the generalized Hausdorff distance h(A,B) [10] defined as,
 | (1) |
 (A,B)
(A,B)
 (B,A).
We then obtain the generalized Hausdorff distance (often and henceforth simply
called the Haussdorff distance) as,
 | (2) |

|
The fundamental reason for the disconnect between the visual notion of proximity and the mathematical notion of distance is that the human visual system is highly non-linear and the notion of proximity is dependent (rather than independent) on the size and geometry of the elements. Such a dependence violates the basic axioms of a metric space. Indeed, it is for that reason we have been using the word “proximity” rather than “distance” in the text so far.
We propose two measures - the first captures the relative orientation between the two elements and the second captures the notion of proximity through some computations defined on the projection of vertices on the axis of orientation (we will clarify this shortly).
To capture the relative orientation, we use a simple scheme which is as follows.
For a given element e(i), we divide the region surrounding e(i) into eight regions using
axis parallel lines. The area of the footprint of the element e(j) in each of the eight
regions is stored in a vector q(ij) = [q1(ij) q2(ij) ...q8(ij)] (see Figure 4). We
normalize the vector q(ij) by dividing each element by  k = 18qk(ij). The
relative orientation between the two elements is then defined by the axis which
makes an angle
  (ij) measured counterclockwise from the horizontal where,
 | (3) |
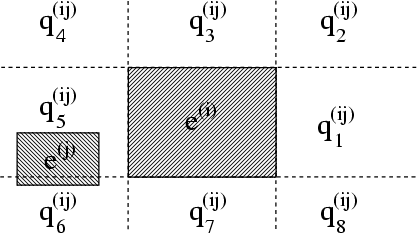
|
One may observe that the definition of  (ij) as given by Equation (3)
captures the intuitive notions of left-of, right-of, top, bottom, etc. that are
most often used in human perception. For example, when e(j) is in region 1
(the one associated with q1(ij)) then q1(ij) is large and the angle is small.
When the footprint of e(j) in region 2 is large but partially also in region
1, then the angle is larger than
  but less than
  /2 and so on. The
factor (k - 1) essentially adds increments of
  /4 as the footprint of e(j)
moves from one (lower numbered) region to the next (higher numbered)
region.
One may also observe that when an element resides entirely in one region, then
the computed  (ij) is independent of the exact location within that region. When
e(i) is larger in length (horizontally), then the regions numbered 3 and 7
are also longer. This results in less sensitivity to displacement of e(j) in
one of these regions when the element is entirely in that region. Similar
arguments apply to regions 1 and 5 when e(ij) is wider (vertically). On the other
hand, the computed value of
  (ij) is most sensitive when the element falls at
the border of two regions. It is here that the transition from say, left-of to
left-top or left-top to top etc. take place. The behavior of the described
measure thus corresponds closely with our own interpretation of relative
orientation.
Results pertaining to the computation of the relative orientation appear in Section 4.
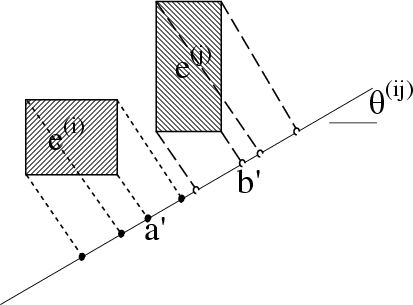
To obtain a measure of the proximity between the elements e(i) and e(j), we project
the vertices of the bounding rectangles of e(i) and e(j) on to the direction  (ij). Recall
that
  (ij) was defined to capture the relative orientation between e(i) and e(j). Say
that the vertices of e(i) are in the set A and the vertices of e(j) be in the set B. Let a'
be the projection of a
  A on the line which makes an angle of
  (ij) with the
horizontal. In a similar manner, let b' be the projection of b
  B on the same line (see
Figure 5). Then the measure of proximity between e(i) and e(j) is given by,
 | (4) |
 | (5) |
 is a specified constant. This form of f(.) was attempted in the formation of
sparse codes for natural scenes leading to a complete family of localized, oriented,
bandpass receptive fields [11]. Because of a sharp peak and a heavy tail, it has a high
localization property but at the same time points that are further apart still influence
the overall proximity.
|
The proximity as given by Equation (4) is thus computed on the basis of the effect that we believe is caused by points which are separated by some distance. However, because p(ij) is formed based on all the vertices it does not suffer from the same disadvantages that point-to-point measures suffer from. Moreover, because the proximity is determined based on the summation of effects, its results are more closely aligned with our own interpretation of proximity. In Section 4, we present some results based on this proposed measure of proximity.
In this section, we present some experimental results obtained with the proposed measures of orientation and proximity.
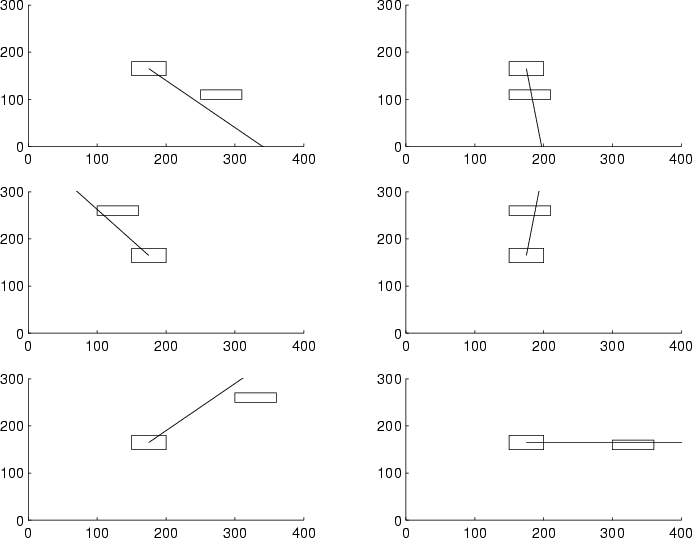
Results pertaining to the orientation measure appear in Figure 6. In each panel of
the figure, two elements are shown at different orientations. The line shown in each
panel has a slope of  (ij) and is computed from Equation (3). Note that this axis of
orientation is in support of the orientation that would be assigned by a human
observer.
|
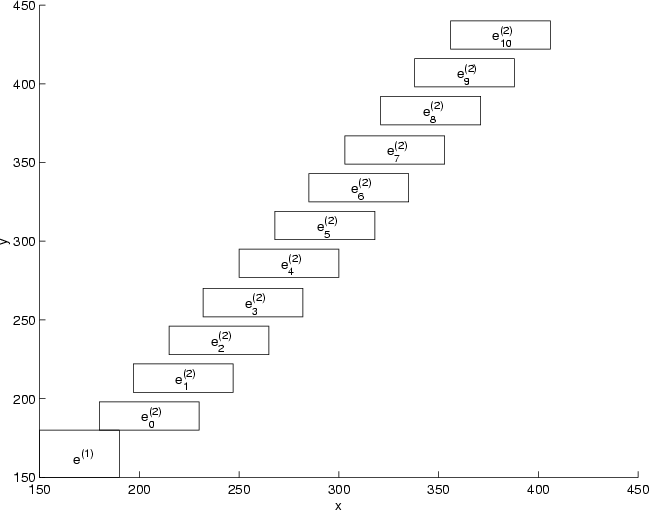
To obtain the results for the proposed proximity measure, we fixed the position of
the element e(1) and moved e(2) gradually further from e(1) (see Figure 7). In this
Figure, the notation et(2) implies the location occupied by the second element at
some time t. Figure 8 shows the proximity as computed from Equation (4) from two
different values of  . An increased value of
  leads to a more gradual decrease in
proximity as the elements move further apart. However, as the figure shows, the
proximity decreases sharply initially and then decreases at a slower rate as is
desirable.
|
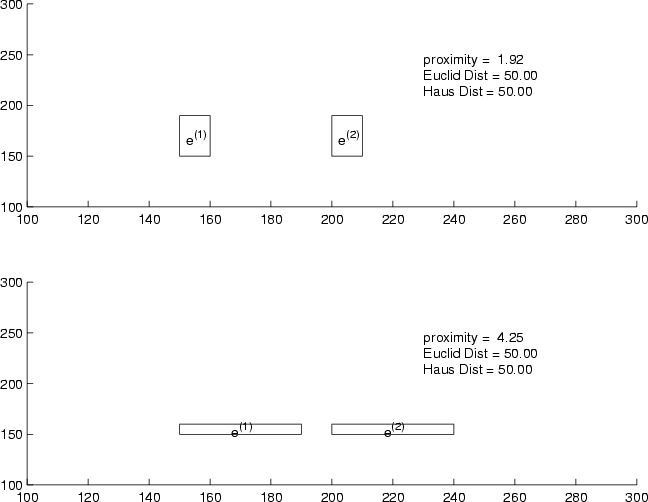
It is also interesting to consider some pathological cases which arise when the aspect ratio of the elements are varied. For example Figure 9 shows two situations in which the aspect ratios of the elements in the top panel is quite different from that in the bottom panel. In either case, the Euclidean and the Haussdorff distances are the same even though perceptually the separation in the two cases is quite different. The proposed proximity measure does accurately distinguish between these cases.
|
In this paper, we presented perceptually motivated measures for capturing the relative orientation and proximity of web page elements. We believe that capturing the notion of proximity in a perceptually motivated way forms the cornerstone of a strategy to automatically evaluate the layout of web pages. In the following, we provide the outline of one possible framework for automatically evaluating the layout of web pages.
In the framework, we represent the contents of a web page using a fully connected weighted graph. For example, Figure 10 shows a sample web page and the corresponding bounding box of each element. The nodes of the graph represent the elements and weights of the edges between the nodes are defined based on the inter-element relational descriptors as well as the amount of area occupied by the element.
Succinctly, elements e(i) and e(j) are represented as nodes and the weight of the interconnecting edge between them is given by,
 | (6) |
 (.) is an appropriate function which can be formed based on reinforcement
learning principles.
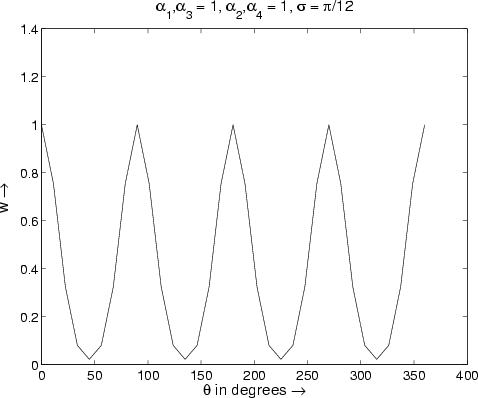
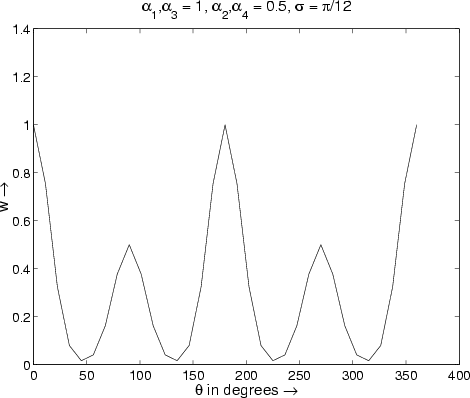
It is also possible to use first principles (usability guidelines) to obtain wij. For
example, assuming the convention that higher weights indicate better element
positioning, one can capture the fact that horizontal and vertical alignment are
preferred by the following,
 | (7) |
 k and
k and  are constants. Note that wij is largest when
  (ij) is 0,
 /2,
/2, ,3
,3 /4 or
2
 (see the left panel of Figure 11). These values of
  (ij) correspond to horizontal or
vertical alignment between elements e(i) and e(j). The
  k’s allow differentiation
between horizontal and vertical alignment (see the right panel of Figure 11) and the
behavior in between the local maxima can be controlled through
  . This differenation
between the horizontal and vertical alignment is required for consistency with the
early selective attention mechanism prevailing in the human visual system. This has
also been studied and modeled in the object perception network for reading text
[12].
|
Similar to the above specification, the dependence of wij on the other variables as given in Equation (6) can be specified. In this way, it is possible to obtain the edge strengths of the graph. Under the assumed convention that higher edge strengths indicate better relative positioning between e(i) and e(j), an aggregate measure of the overall layout quality can be obtained by summing up all the edge strengths. A normalization relative to the number of elements on the page can be done to allow for comparison of the quality of pages with varying number of elements.
The general framework we have presented in this section is not the only possible one. Irrespective of the particular framework, we believe that the measures of proximity that were developed in this paper will be useful in the automatic evaluation of web page layouts.
[1] M. Pearrow, Web Site Usability Handbook, Charles River Media, 2000.
[2] J. Nielsen, Designing web usability: The practice of simplicity, New Riders Publishing, 2000.
[3] C. B. Mills, and L. J. Weldon, “Reading text from computer screens,” ACM Computing Surveys, Vol. 4, pp. 329-358 1987.
[4] “Research Based Web Design & Usability Guidelines,” NCI, [http://www.usability.gov/guidelines/layout.html].
[5] A. Parush, R. Nadir, and A. Shtub, “Evaluating the layout of graphical user interface screens: Validation of a numerical computerized model,” International Journal of Human-Computer Interaction, vol. 10, no. 4, pp. 343-360, 1998.
[6] J. M. Spool, W. Schroeder, T. Scanlon, and C. Snyder, “Web sites that work: Designing with your eyes open,” Proc. CHI 98, pp. 18-23, 1998.
[7] M. Bernard, B. Chaparro, and R. Thamasson, “Finding information on the web: Does whitespace really matter?” Usability News, Winter 2000. [http://psychology.wichita.edu/surl/usabilitynews/2W/whitespace.htm]
[8] M. D. Byren, J. R. Anderson, S. Douglass, and M. Matessa, “Eye tracking the visual search of click-down menus,” Proc. CHI, pp. 402-409, 1999.
[9] K. Mullet, and D. Sano, Designing visual interfaces: Communication oriented techniques, Sunsoft Press, Mountain View, CA, 1995.
[10] G. Rote, “Computing the minimum Hausdorff distance between two point sets on a line under translation,” Information Processing Letters, v. 38, pp. 123-127, 1991.
[11] B. A. Olashausen, and D. J. Field, “Emergence of simple-cell receptive field properties by learning a sparse code for natural images,” Nature, vol. 381, pp. 607-609, 1996.
[12] M. C. Mozer, The perception of multiple objects : A connectionist approach, MIT Press, 1991.