Many image collections contain few or no index terms. To search these collections, a battery of techniques known as Content Based Image Retrieval (CBIR) is used. With CBIR, the user need identify only an image exemplar. The exemplar is processed to extract content measures such as greyscale, lines, and angles. These measures are matched against a database of identical measures for a collection and the results returned to the user. The matching process between image search example and stored image content measures is complex and requires sophisticated data management support. In this paper, image content measures are encoded as metadata tags for the images, and included in the html image header. The support requirements are eliminated. Searching is simplified. Image content index measures are conveniently carried along with the image in an html wrapper. Collections demonstrating the technique are WWW available. Image processing and search software is available without copyright or fee from the author. Details of the processing code are included.
Image retrieval, image processing, image management, metadata, content based image retrieval.
By now, many are familiar with the basic features of the several widely used content based image retrieval (CBIR) products. One of these, Virage, uses row, column sampling for image retrieval. Another two, Excalibur and QBIC-(IBM), use image decomposition techniques. Excalibur and IBM also use these techniques for scene analysis of moving image documents. Moreover, there exist hundreds of important areas (e.g., landsat imagery, engineering diagrams, trademarks, etc.) where CBIR performs quite well.
CBIR owes it origins to the seminal work of David Marr who was first to note that primitive image features, such as lines, edges, angles, greyscale, RGB, spatial proximity, etc, were adequate for a machine to extrapolate meaning sufficient for limited image understanding, pattern matching, and retrieval. Although many such primitive measures are possible, there is no set of optimal ones that lead to perfect retrieval. Rather, it is the case that more measures tend to work better than a few, and that, in any case, all such measures must be invariant over image operations such as rotation and inversion .
In a typical procedure, pixel values from an image are placed in histogram intervals. For example, greyscale values for an image would be placed in histogram intervals from 0-255. The histogram is then stored in a DBMS, and is "searched" by comparison of the histogram values of an exemplar image extracted in the same manner with the stored values. The major efficiency drawback to this technique is that the extracted image information is considerable, and must be stored separately from the image in a file typically linked to the image source by a DB pointer. In the procedure of this paper, histogram values are converted to a single value referred to as a Lorenz Information Measure (LIM) using a technique known as a Lorenz Transform (LT) [1]. In an LT, the shape of the histogram values are recorded through differentiation, and thus reduced to a single number. These numbers may then be recorded as metadata name tags in Illustration 1.
The retrieval algorithm is thus to compare for each tag of the exemplar image, the absolute difference between the first value (e.g. greyscale) of the image collection, stopping the search when a user established threshold has been reached. Moreover, since the tag values are grouped as shown, different thresholds may be established for different classes of measures such as color or shape.
The image processing software and search system may be obtained from the author through an email request. The paragraphs below describe the system search software and the algorithms used to create the invariant measures encoded as metadata.
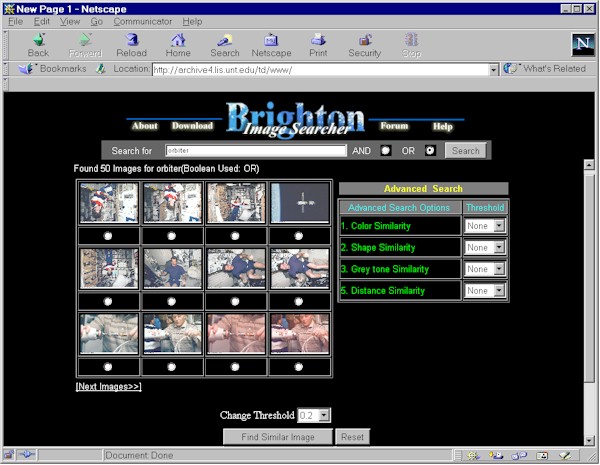
A collection of 1126 images primarily from the NASA STS82 Hubble Telescope Repair Mission has been assembled for searching. The search system is initiated by entering text terms and depressing the top right search button shown in the illustration below. From the set of images retrieved by words, a single image is selected. The invariant features of this exemplar image are matched against other images on either all twelve measures of the images or on a subset of image features. Image features are themselves grouped into four categories: color, shape, greyscale, and distance. The illustrations below provide examples of two searches, although readers of this paper are encouraged to use the system for direct experience. The system is referred to as the Brighton Image Searcher since it was first introduced at the Brighton Beach third international conference sponsored by the University of Northumbria entitled "Challenge of Image Retrieval." [2, 3]
Illustration 1: Opening screen of the Brighton Image Searcher with an initally retrieved set of images in response to the search term "orbiter".
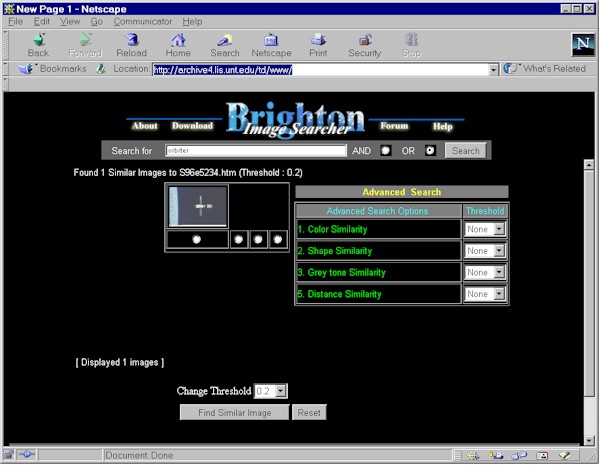
Illustration 2: Retrieval results from selection of the Hubble Telescope as an image exemplar and a subsequent search conducted without reference to categories of feature clusters.
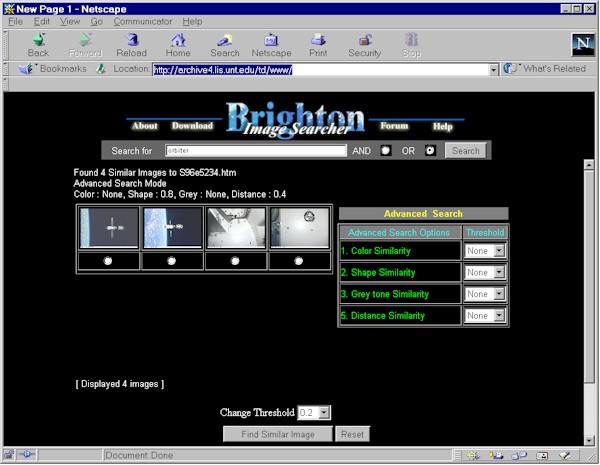
Illustration 3: Retrieval results from selection of the Hubble Telescope as an image exemplar and a subsequent search conducted with reference to categories of feature clusters, in this case emphasis of shape and pixel distance from the origin of the image. Note that the two images retrieved that are not the space station, still bear a resemblance to the appropriate retrievals in that both contain an angular object in the center and an altered shape to the left of the image represented in the station images as the limb of the earth.
It is not, however, the focus of the paper to ascertain the effectiveness of the particular image measures used for this paper. Rather, the point is the ability to encode these measures as metadata. The consequences of this technique for retrieval are important because of the conservation of bandwidth. Without retrieving the images, algorithms can determine whether an image fits a given search criterion. This may be especially important for the use of intelligent agents that would be able to make their selection based solely on the metadata without fetching the image.
Implementation of such a system would require only use of a suite of standard image processing measures that could be implemented as a simple set of routines in Java equipped with the standard image processing libraries. Since this project is a prototype only, the specific measures have been implemented in MatLab alone. MatLab is a common statistical programming package. [4]
Since 1980, many theories to analyze images for purposes of retrieval have been proposed by numerous researchers. However, none of these approaches was so successful that any one could be used alone for image information retrieval. In the 1980s, a specific innovation was proposed by Chang and Yang [1] to simplify image data derived largely as histograms in order to ease processing requirements. They suggested a formula called a Picture Information Measure (PIM) generalized from the classical Lorenz Information Measure (LIM) widely used in economics.
Rorvig [5, 6] was among the first to suggest use of general features extracted from the images for retrieval and represented as LIMs. In his research, six general pattern features were used: gray levels, edge intensity, edge slope, line length, line distance from the origin and angle distance from the origin. Other researchers such as Deng and Manjunath [7, 8] explored color features while Han and Myaeng [9] proposed image analysis based on relative changes in image pixel values. During this period, many researchers [10] proposed different approaches to achieve content-based information analysis for image information retrieval.
However, all of the approaches had pros and cons. In addition, availability of the source code was limited and posed an obstacle in expanding the knowledge of the underlying image processing techniques. For that reason, for this research, an open source policy [2] has been practiced. Image processing is done in a commonly available commercial package using transparent, easily replicated techniques. In our research, twelve content-based image features are derived. The image below is used as an example of feature extraction and histogram creation.
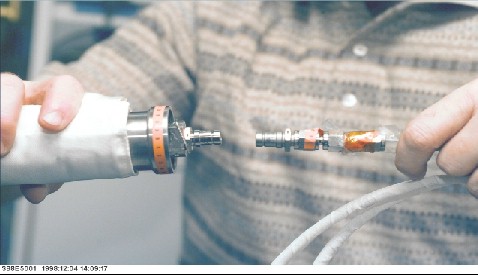
Illustration 3: NASA instrumentation photo (ground).
From each image twelve features are extracted: 1) Red, 2) Green, 3) Blue, 4) Gray, 5) Distance-A (Distance from the origin of the image to a specific pixel), 6) Angle, 7) Hough Transform, 8) Distance-B (Distance from side-A to the pixel), 9) Distance-C (Distance from side-B to the pixel), 10) Distance-D (Distance from side-C to the pixel), 11) Distance-E (Distance from side-D to the pixel), and 12) Density.
All twelve measures except the Hough Transform can be extracted from the images directly. For example, in color images each pixel has a value that ranges from 0 to 255 for Red, Green and Blue. Features requiring edge detection in images can be derived from grayscale images using the "[c1,ct1] = edge(a,canny, [], 1.0)" function in Matlab. The rest of the features were extracted from the image after edge detection. In the examples that follow, only six of the twelve measures are explicated due to space limitations. additional documentation is available upon request from the author.
Based on the data extracted from the original color, grayscale, and edges of an image, eleven histograms except density could be drawn. (Figure 2-8) A histogram is a very useful representation of the distribution of data and is easily drawn using the Matlab commands shown below, followed by histograms of six extracted LIM values.
for f = 5001:5026
ifname=sprintf('/export/olddata/mrorvig/jktmat/data/sts88/mdist%4.0f.dat',f);
    fid = fopen(ifname,'r');
ofname=sprintf('/export/olddata/mrorvig/jktmat/data/sts88/hdist%4.0f.dat',f);
    fido = fopen(ofname,'w');
    x = 1:1:256;
    y = fscanf(fid,'%5d');
    r = hist(y,x);
    rr = r';
    for i=1:256
        fprintf(fido,'%10.f\n',rr(i));
    end
    fclose(fid);
    fclose(fido);
end
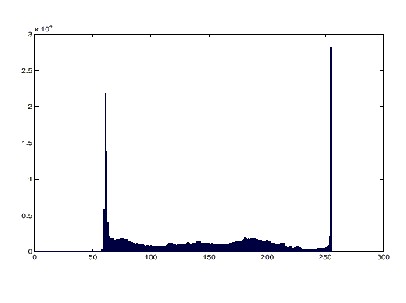
Illustration 5: Example of the histogram for Red values of the ground instrumentation image shown above.
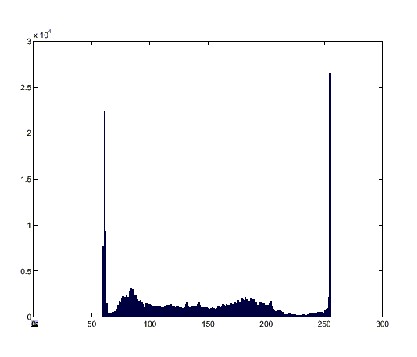
Illustration 6: Example of the histogram for Green values of the ground instrumentation image shown above.
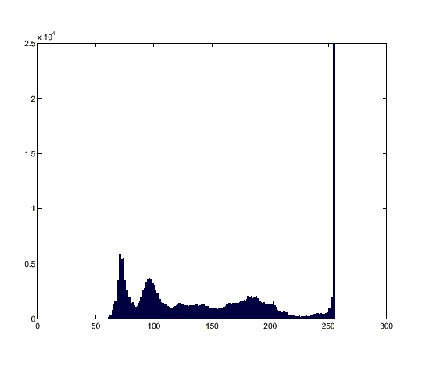
Illustration 7: Example of the histogram for Blue values of the ground instrumentation image shown above.
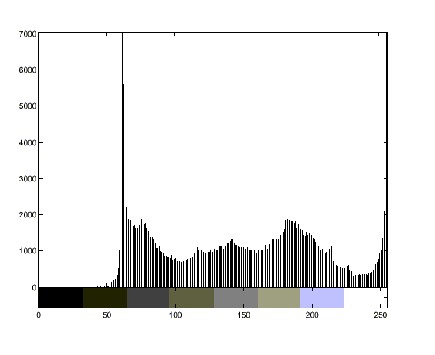
Illustration 8: Example of the histogram for Grey values of the ground instrumentation image shown above.
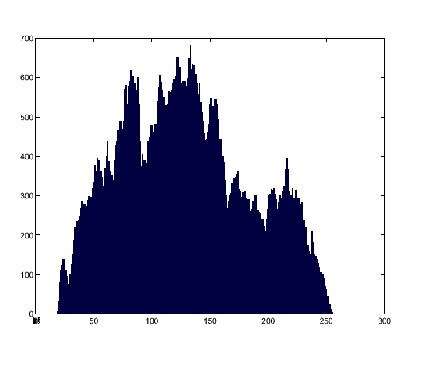
Illustration 9: Example of the histogram for Distance values of the ground instrumentation image shown above.
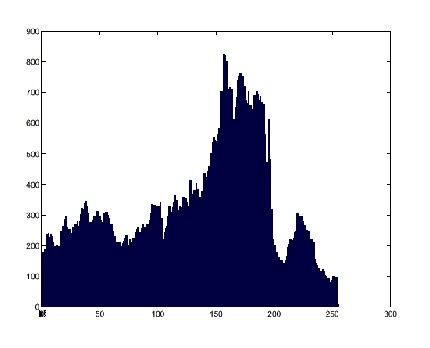
Illustration 10: Example of the histogram for Angle values of the ground instrumentation image shown above.
The Lorenz Information Measure [1] (LIM) (P1, .,Pn) is defined to be the area under the Lorenz information curve (Figure 11). Thus from Figure 11, the area of LIM Ca is greater than the area of LIM Cb. Clearly, 0 < = LIM (P1, ., Pn) < = 0.5. For any probability vector (P1, .,Pn), LIM (P1, .,Pn) can be calculated by the first ordering Pis, then calculating the area under the piecewise linear curve. Since LIM (P1, .,Pn) (which can be expressed as the sum of f(Pi), and f(Pi)) is a continuous convex function, LIM (P1, .,Pn) is considered as an information measure. Intuitively, the LIM can be regarded as a global content-based information measure. To compute the area of histograms the histogram intervals are sorted from low to high, and the resulting off-diagonal shape measured through differentiation.
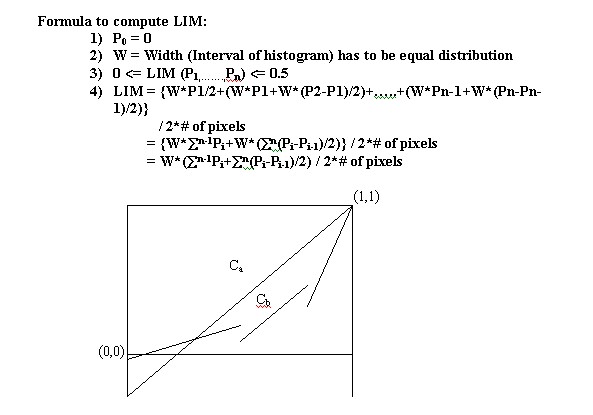
Illustration 11: General shape of Lorenz information curve.
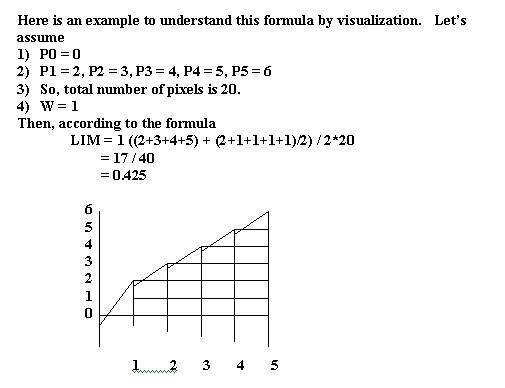
Illustration 12: Picturesque example of Lorenz information curve.
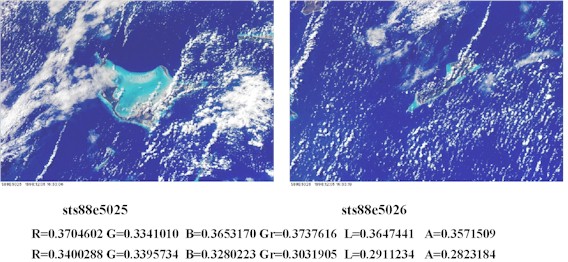
Illustration 13: Two images from sts88 and their associated values for red, green, blue, grey, line length, angles, and edge intensity after histgram transformations to Lorenz values.
After extracting the histograms and converting them to Lorenz Information Measures, they are encoded into the html header as metadata tags. By clicking on an image in the search matrix, a fullsized version of the image may be viewed. The browser view source command may then display the metadata tag structure. These tags are shown in the illustration below.
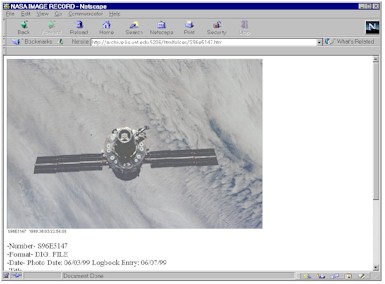
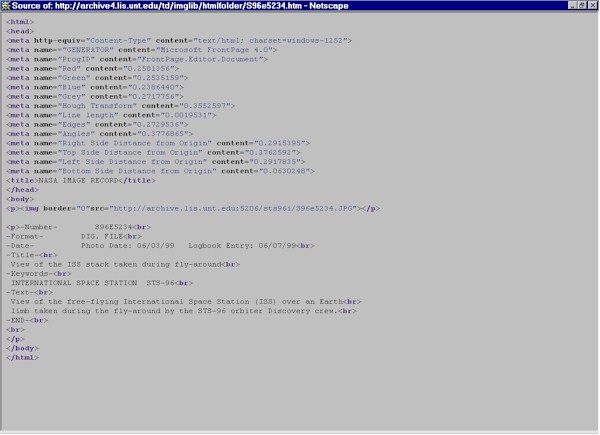
Illustration 14: Image of the Hubble Telescope and its associated metadata in tags.
ACKNOWLEDGEMENTS
This paper was supported by Intel Corporation.