We propose a new Web search system that helps users clarify their information needs through interaction. The system represents the user's information needs as a query graph: a set of graph objects. This graph is presented to the user and interactively refined until the user is satisfied with the documents retrieved. In this way, the user can find the desired documents even if his original information needs were unclear. This article describes the concept and outlines the system.
Web search, information needs, graphical interface, interaction, relevance feedback.
People often try to search the Web with poorly specified information needs. Unfortunately, most Web search systems, including those with powerful ranking algorithms, do not satisfy these people. This is because existing search systems expect users to give well-specified queries, which is difficult for the people whose information needs are vague. Relevance feedback [1], which modifies the original query based on the user's judgment of previous search results, may support the users somewhat. Simple relevance feedback, however, prevents the user from understanding how the relationships between the query and the documents are judged to be relevant, because it automatically modifies the original query while concealing the modification process from the user. A penetrable interface that allows the user to control the relevance feedback search process has been shown to be more effective [2].
In addition to controlling the search process, an interface that effectively represents user's information needs and clarifies the needs through interaction is indispensable in supporting users with vague information needs.
We propose a new search system with a human interface that uses a graphical form to visualize the user's information needs and navigates the user to the desired information by manipulating the form.
Boolean queries and natural language queries are widely used in the field of Information Retrieval (IR). Boolean queries are a powerful way to represent clear information needs, but they are not suitable for representing vague information needs. Natural language queries appear more suitable for this purpose, but accurate evaluation of natural language queries is still difficult.
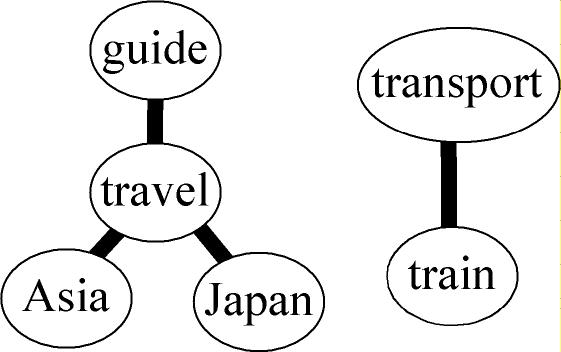
In the field of Artificial Intelligence, Semantic Networks, which are graphs of linking concepts, are often used to represent ideas. It seems intuitive for humans to think in terms of using the relationships of concepts. Accordingly, we decided to utilize a graph of linked concepts to represent information needs. Each graph, called a query graph, sets a word at each node; the association between words is represented as a link. A link can be thought of as Boolean 'and' or 'proximity'. Two independent nodes that have no link indicate Boolean 'or'. For example, Figure-1 depicts the information needs of 'travel guide to Asia or Japan, or transportation by train'. It is obvious that query graphs can well visualize our information needs.
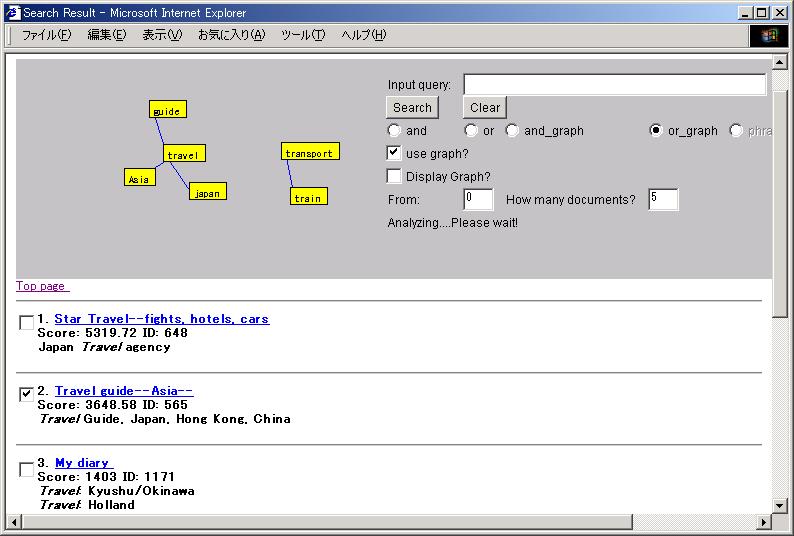
The user can interactively clarify his/her vague information needs, by looking at and editing the query graph. Figure-2 depicts the user interface of our search system. The steps in refining a query graph are as follows.
In this way, the user clarifies his/her vague information needs by selecting relevant documents, and editing query graphs interactively. The user obtains the desired search results in response to a query graph that represents the clarified information needs of the user in an easy-to-understand manner.
As a preliminary evaluation, we showed a query graph and a list of terms, both representing the same information needs, to 5 users. All users indicated that the query graph was more intuitive and made the task (discerning the search goal) easier to understand than the list of terms. Comprehensive evaluations are planned of the interactive search process as well as query graph performance.
The proposed query graph has weights on its nodes and links, but these values are currently not visible, nor are they editable. Size or color clues could be utilized for visualizing them. The current query graphs use one word to represent one concept, but it is reasonable to expect that some concepts will actually need several words. We want to enhance the query graphs to handle such concepts, and different types of relations such as 'agent', 'object' and 'place'.
We have created a new search system that can clarify vague information needs. Because its process is visible and controllable, users can efficiently find the desired documents. Subject graph matching can measure the score between a query graph and each document precisely.
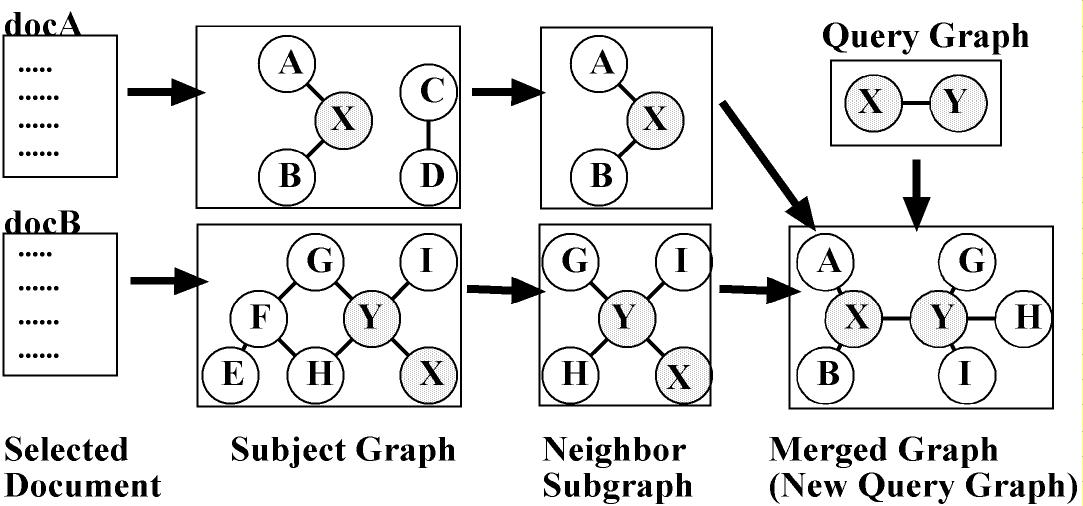
Each document is translated into a query graph (Figure-4). Each node represents a term in the text, while a link represents an association between the linked terms. Significance of the terms and the term-term associations are represented as weights assigned to them.
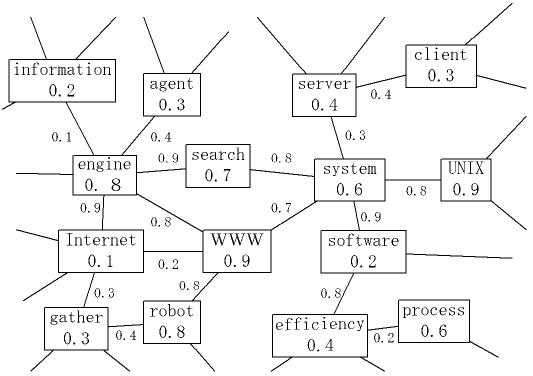
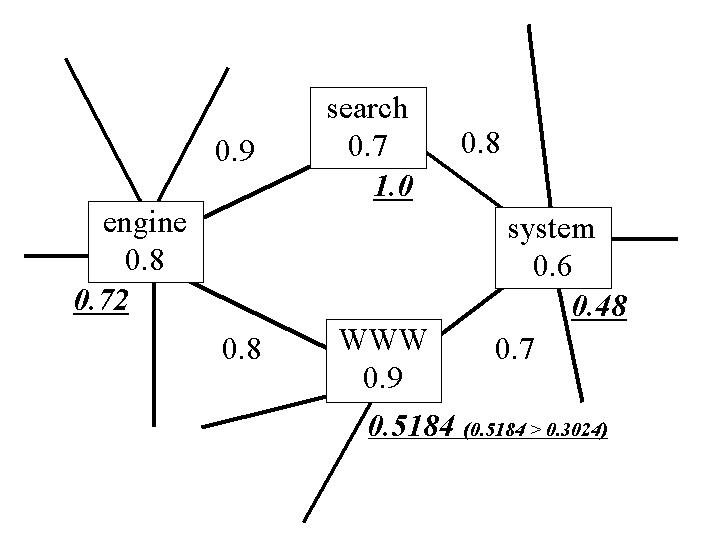
Figure-5 depicts the algorithm for query graph matching.
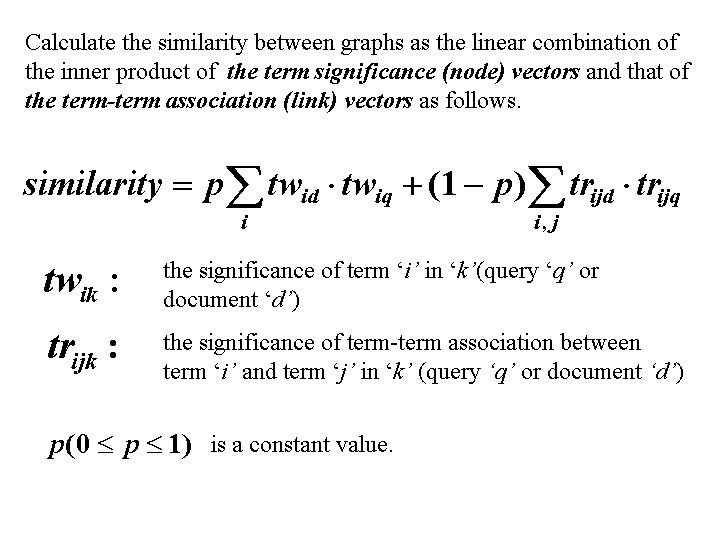
Figure-6 depicts the algorithm for extracting the neighbor subgraph.
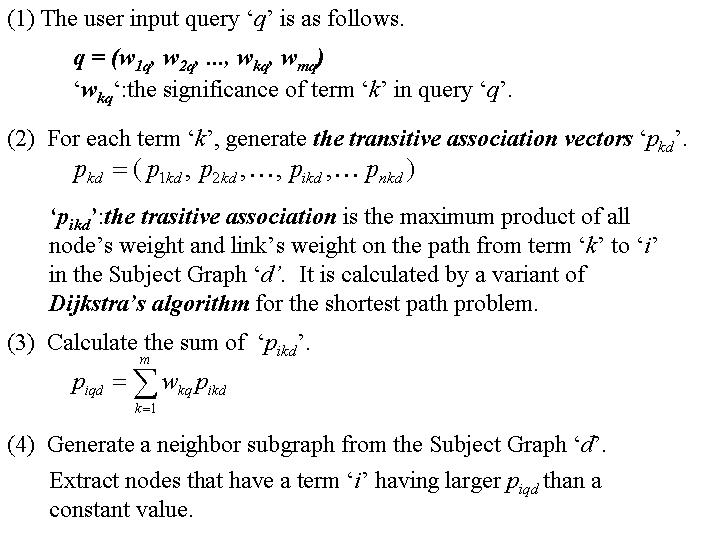
Figure-7 depicts an example of transitive association in the algorithm. Italic numbers represent the transitive associations of each term from 'search'.